Faculty and Librarian Complement Breakdown by Sex: 2020-21
December 2021
Diversity, inclusion, respect, and civility are among the University of Toronto’s fundamental values. Outstanding scholarship, teaching, and learning can thrive only in an environment that embraces the broadest range of people and encourages the free expression of their diverse perspectives. Indeed, these values speak to the very mission of the University.
President’s Statement on Diversity and Inclusion, 2015
The University of Toronto is committed to diversity in the faculty complement. As part of this, we pay close attention to the breakdown of the complement year over year. The University’s Employment Equity Report (PDF), which is published annually, reports on how faculty and staff self-identify in respect to a range of categories in responding to the University’s equity survey.
The Faculty and Librarian Complement Breakdown by Sex report presents a different analysis for the purpose of comparison and comprehensiveness. In addition to looking closely at what can be learned year-over-year from the equity survey results, since 2014-15, the Office of the Vice-Provost Faculty and Academic Life has produced this report that looks at all appointed faculty in the tenure and non-tenure stream and in the teaching stream using the indicator “sex” in the University’s Human Resources Information System (HRIS)1. The reports measure trends year-over-year in relation to a base year: 2004-05 in the tenure stream, 2016-17 in the continuing stream, teaching stream, and 2015-16 for permanent status/permanent status stream librarians.
The “sex” indicator in HRIS allows us to look at the whole population of appointed faculty and librarians rather than only at those who chose to respond to the University’s equity survey. It also allows us to look at the composition of the group of faculty who serve in leadership positions on a year-over-year basis — information that is not possible using the equity survey data. Note, however, that the data in HRIS allow us only to look at sex. The system does not include other population-based data.
The first Faculty Gender Equity Report2, described the complement in 2014-15 and established the 2004-05 academic year as a baseline. It focused exclusively on tenured and tenure stream faculty and continuing stream, teaching stream faculty. It also included a separate section on clinical faculty. Subsequent reports analyzed the same categories of faculty in 2015-16 and 2016-17; 2017-18; and 2018-19 and 2019-20.
This report continues with the format of the 2018-19 and 2019-20 report, which evolved slightly from the initial three reports:
- It continues to focus on tenured/tenure-stream and continuing stream, teaching stream faculty: they comprise about 80% of all appointed faculty at the University of Toronto (n=2,682).3
- This report, as the pervious report, includes an additional section of data for all appointed faculty. This includes both contractually limited term faculty in the non-tenure stream and the teaching stream as well as comparable part-time faculty.4
- Data for all librarians, including both permanent status or permanent status stream, and non-permanent status stream librarians at all ranks (Lib I, Lib II, Lib III, Lib IV) are also now included. As for appointed faculty, the focus is on permanent status and permanent status stream librarians.
- Earlier reports included data on clinical faculty. They have been excluded from the past two reports: the medical doctors who serve as clinical faculty at the University of Toronto are not appointed by the University. (Only a very few clinicians who are paid by the University and are tracked as part of the appointed faculty complement are included in this report.)
- Finally, as was the case in the 2018-19 and 2019-20 report, this report talks about the categories “male” and “female.” Previous reports used the language of “men” and “women” and were labelled reports on “gender.” Over time at the University this language has solidified. Our Employment Equity Report reports on how employees self-identify in respect of gender: whether they self-identify as “men” or “women” or “transgendered.” In this report, we are looking at the Human Resources Information System (HRIS) sex indicator which includes “male,” “female,” and “another.” This latter category was added in December 2017, to the main HRIS to allow all employees, including transgender individuals, and those who do not identify as male or female, to have an alternative to the binary male/female categories. Starting with our 2018-19 data, this option, has been included in our data.
This fifth report provides data for the 2020-21 academic year.
1 The Office of the Vice-Provost Faculty & Academic Life has produced four reports to date covering 2014-15; 2015-16 and 2016-17 combined; 2017-18, and 2018-19 and 2019-20 combined. The data is based on a consistent fall data count.
2 Prior to the 2018-19/2019-20 report, the Faculty and Librarian Complement Breakdown by Sex report was called the Faculty Gender Equity Report.
3 This figure is based on data used in this report for 2020-21. The percentage of those in continuing, non-clinical appointments at the University is reported as slightly lower than in previous reports, because the denominator includes those who have reduced their full-time equivalents (FTEs), as well as part-time appointed faculty in non-continuing appointments.
4 The majority of our clinicians are not included in this report as they hold non-appointed positions at the University. A small number of clinicians (approximately 5% of the complement in 2020-21) are included in this report as they hold appointed positions and are paid directly by the University.
This report shows very little change from earlier analyses (unless otherwise stated, figures cited below are for 2020-21):
- Campus variation: The proportion of appointed faculty who were female varied slightly by campus. At the University of Toronto Mississauga (UTM), 39.3% of appointed faculty were female. This is slightly lower than the St. George campus where 41.9 % of appointed faculty were female. At the University of Toronto Scarborough (UTSC), 47.8% of all appointed faculty were female.
- Intersection of sex and rank:
- Tenure Stream: The balance between male and female amongst tenured/tenure stream faculty was fairly equal at the rank of Assistant Professor, and close at the rank of Associate Professor. However, males represented 69.8% of tenured faculty at the rank of Professor, as opposed to the 30.1% of tenured faculty at the rank of Professor who were female.
- Continuing Stream, Teaching Stream: The proportion of male and female faculty within the continuing stream, teaching stream remained fairly equal — 48.1% were male compared to 51.9% who were female. There was a very slight increase in the proportion of faculty who were female in the continuing stream, teaching stream since 2016-17, increasing from 50.3% to 51.9%.
- Leadership highlights: The representation of faculty who were female amongst the leadership of the University was broadly proportional to their representation amongst the ranks of tenured faculty, from which most leaders are drawn. Notably, female representation in academic leadership positions was 25.4% in the 2004-05 baseline and 45.1% in 2020-21.
The initial report focused on the composition of the faculty complement in 2014-15 compared to 2004-05. This fifth report adds data for the most recent academic year, 2020-21. The current report includes data for:
- 2004-05 (baseline year);
- 2014-15
- 2015-16;
- 2016-17;
- 2017-18;
- 2018-19
- 2019-20
- 2020-21 (new data)
In order to make it easier to distinguish the baseline year, data for 2004-05 in the tenure stream, 2016-17 in the continuing stream, teaching stream, and 2015-16 for permanent status/permanent status stream librarians appears in a distinct colour (green).
For the purposes of this report, faculty refers to appointed faculty across all ranks. This includes all faculty appointed in the tenure stream and continuing stream, teaching stream faculty. These two groups are broken out in sections 5 and 6, respectively, specifically with reference to change over time. Appointed faculty also include all contractually limited term appointed (CLTA) faculty (both in the non-tenure stream and the teaching stream) and all part-time limited term faculty (in both the non-tenure stream and the teaching stream), included in section 4 only. Appointed faculty includes a limited number of clinical faculty for whom the University of Toronto serves as the employer, the majority of these people are in the non-tenure stream employee subgroup (F2).
The report also includes sections on both permanent status, permanent status stream, and non-permanent status stream librarians at all ranks (Lib I, Lib II, Lib III, Lib IV).
The source of all the data used in this report is the University’s Human Resources Information System (HRIS). See Appendix D for more details on methodology.
4.1 All Appointed Faculty by Employee Subgroup: 2020-21
Overall, 42.2% of all appointed faculty were female. Within this larger category, faculty who were female constituted 38.4% of faculty in the tenured/tenure stream and 51.9% of faculty in the continuing stream, teaching stream. Note that faculty in these two groups hold continuing appointments. This breakdown by sex has been broadly consistent over the past five years. Other Academics were primarily the Senior Athletic Instructors in Kinesiology and Physical Education (KPE) and the Institute of Child Studies instructors at the Ontario Institute for Studies in Education (OISE).
Figure 1: All Appointed Faculty by Employee Subgroup (all ranks combined), by Sex, 2020-21
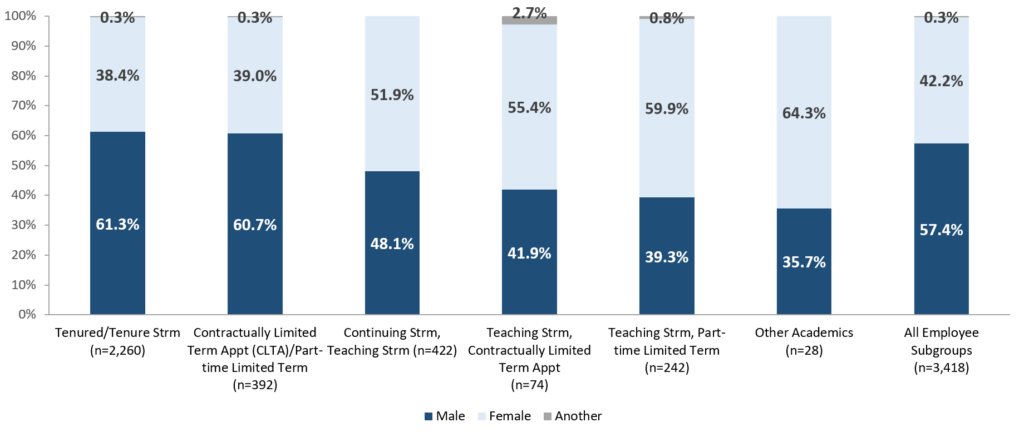
The stacked bar chart shows the sex distribution for U of T’s total appointed faculty complement in 2020-21 by employee subgroup and for all employee subgroups combined. The first two bars show tenured/tenure stream and non-tenure stream contractually limited term appointment (CLTA) and comparable part-time limited term faculty. Both categories of faculty include similar percentages of faculty who were female: 38.4% and 39.0%, respectively. The percentage of faculty who were female in the three teaching stream employee subgroups ranged from 51.9% in the continuing stream, teaching stream; to 55.4% in teaching stream, contractually limited term appointments; and 59.9% in the teaching stream, part-time limited term. In Other Academics, 64.3% of faculty were female. Only a small percentage of faculty were another sex — 0.3% among each of the tenured/tenure stream and CLTA/part-time Limited term faculty, 2.7% among the teaching stream CLTA faculty, and 0.8% among teaching stream, part-time faculty, which amounts to 0.3% in the total complement. The percentage of faculty who were female across all employee subgroups combined is 42.2%.
Appt = appointment.
Strm = stream.
4.2 Appointed Faculty5 by Employee Subgroup by Rank: 2020-21
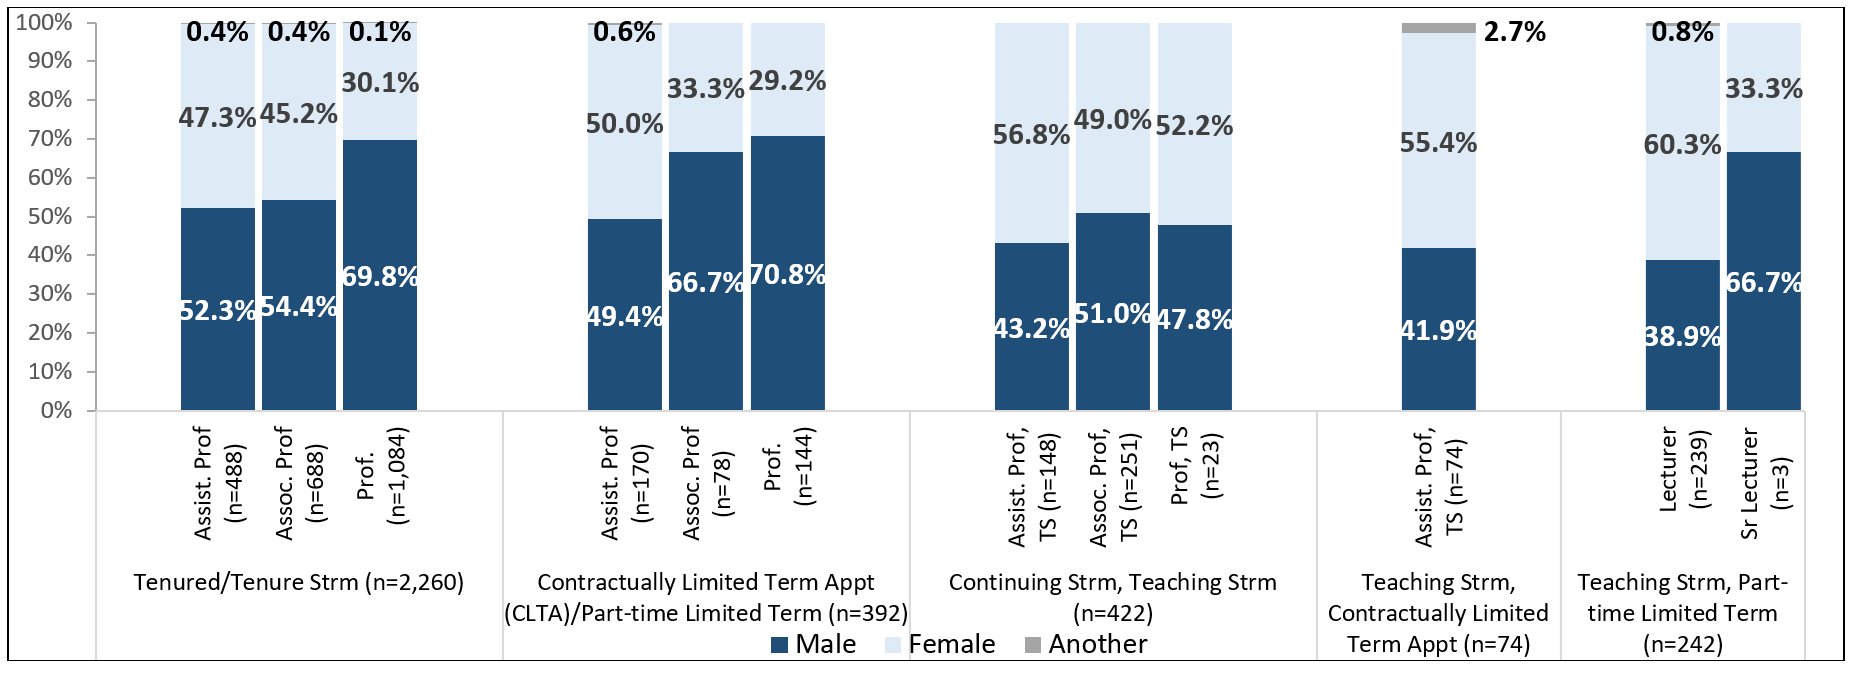
Among tenured/tenure stream faculty the proportion of faculty who were female varied by rank. The same was true of CLTA and part-time faculty in the non-tenure stream. The breakdown by sex was more equal among faculty in the continuing stream, teaching stream across all ranks. The rank of Professor, Teaching Stream was first established effective January 2016. The first faculty were promoted to the new rank in 2018-19 following approval of the Policy and Procedures Governing Promotion in the Teaching Stream. The significant percentage change here is due to the total count of faculty at this rank increasing from 8 in 2018-19 to 23 in 2020-21.
Figure 2: Appointed Faculty by Employee Subgroup, by Rank, by Sex, 2020-21
5 The “Other Academics” group was not included in this chart for purposes of simplicity and clarity, as this is a quite small and largely historic group (n=28).
6 Note that the ranks shown above for part-time faculty in the teaching stream are the ranks that were in effect September 2020; the ranks of all part-time teaching stream faculty were changed to professorial rank, effective October 29, 2020.
The stacked bar chart shows the sex distribution for U of T’s faculty complement in 2020-21 by employee subgroup and rank. Among the tenured/tenure stream 47.3% of Assistant Professors, 45.2% of Associate Professors, and 30.1% of Professors were female; 0.4% of Assistant Professors and of Associate Professors, and 0.1% of Professors were another sex. Among the non-tenure stream contractually limited term appointments (CLTA) and part-time limited term appointments 50.0% of Assistant Professors, 33.3% of Associate Professors, and 29.2% of Professors were female; 0.6% of Assistant Professors were another sex. In the continuing stream, teaching stream the following proportions were female, 56.8% of Assistant Professors, Teaching Stream; 49.0% of Associate Professors, Teaching Stream; and 52.2% of Professors, Teaching Stream. All faculty appointed to teaching stream, CLTAs were at the rank of Assistant Professor, Teaching Stream, of which 55.4% were female and 2.7% were another sex. Among faculty in teaching stream, part-time limited term appointments, 60.3% of Lecturers and 33.3% of Senior Lecturers were female; 0.8% of Lecturers were another sex.
Appt = appointment.
Strm = stream.
TS = teaching stream.
4.3 All Librarians by Stream: 2020-21
The proportion of librarians who were female is much higher as a proportion of the total population of librarians than is the case for faculty.
Figure 3: Librarians by Stream (All Ranks Combined), by Sex, 2020-21
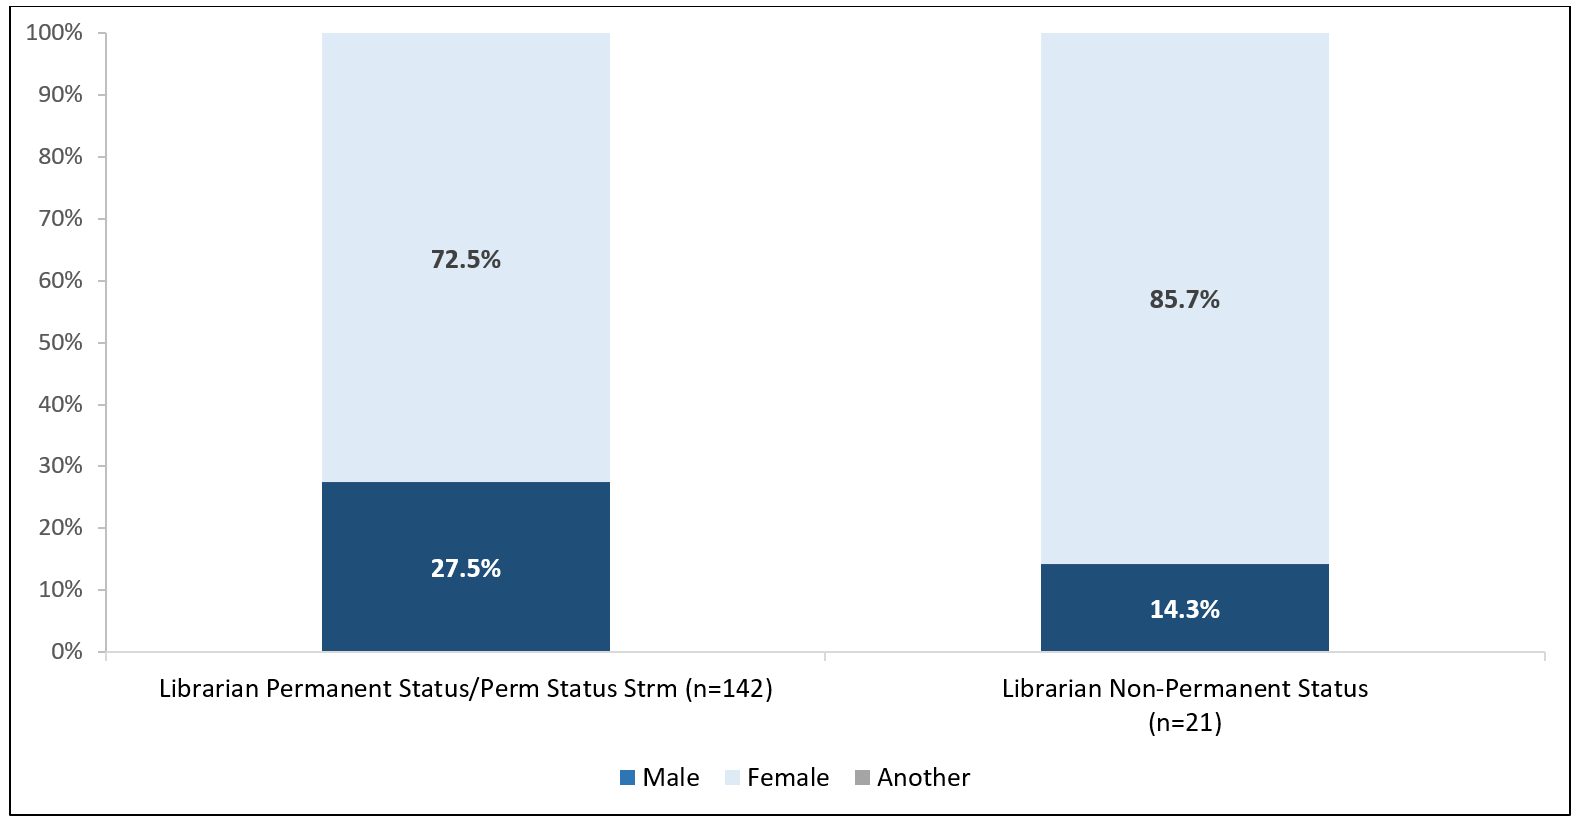
The stacked bar chart shows the sex breakdown of librarians by stream. In the librarian permanent status/permanent status stream (total n=142) 72.5% were female compared to 85.7% of the librarian non-permanent status (total n=21). In 2020-21, no librarians were another sex.
Perm = permanent.
Strm = stream.
4.4 All Librarians by Stream by Rank: 2020-21
The high percentage of librarians who were female was consistent across both streams and all ranks. The career rank for librarians is Librarian III. At the rank of Librarian IV, the breakdown by sex is closer to even.
Figure 4: Librarians by Stream, by Rank, by Sex, 2020-21
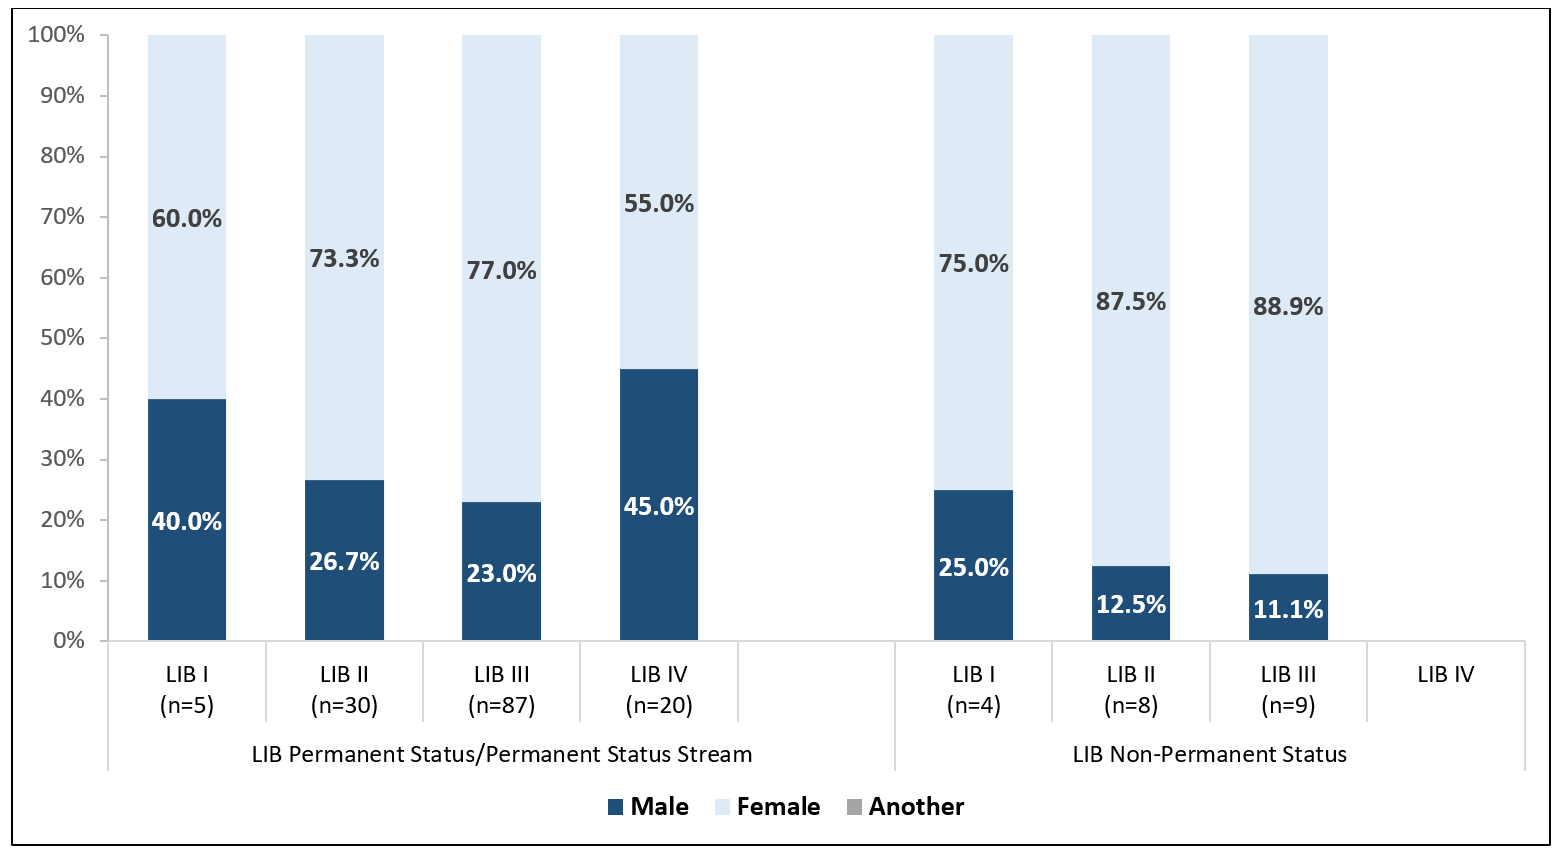
The stacked bar chart shows the sex breakdown of librarians by stream and rank. The majority of librarians were in the permanent status/permanent status stream. In the librarian permanent status/permanent status stream, 60.0% of those at the rank of Librarian I, 73.3% at Librarian II, 77.0% at Librarian III, and 55.0% at Librarian IV were female. As with librarians in the permanent status streams, the majority of librarians in the non-permanent status stream were also female: 75.0% of those at the rank of Librarian I, 87.5% at Librarian II, and 88.9% at Librarian III were female. There were no librarians in the non-permanent status stream at the rank of Librarian IV.
LIB = librarian.
5.1 Tenure Stream Faculty: by Sex, Pattern Over Time to 2020-21
The proportion of the University’s tenured and tenure stream faculty complement who were female increased from 29.6% in 2004-05 to 38.4% in 2020-21. The total number of faculty in the tenure stream at the University of Toronto who were female in 2020-21 was 868, which is 318 more than in 2004-05.
Figure 5: Tenure Stream Faculty (All Ranks Combined) by Sex — Over Time to 2020-217
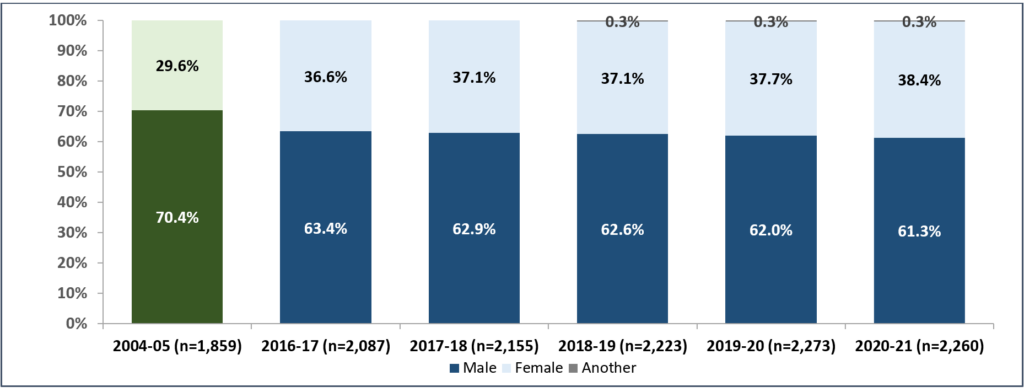
7 Starting in 2018-19 the data on tenured and tenure stream faculty includes all tenured and tenure stream faculty, including those who have, for a variety of reasons, reduced their FTE to a part-time FTE. For all prior years, the data is limited to only full-time tenured and tenure stream faculty (FTE equal to or greater than 76%), and those on phased retirement.
The stacked bar chart shows the sex distribution of tenured and tenure stream faculty (all ranks). It uses 2004-05 data as a baseline. Compared to baseline data, the proportion of faculty who were female increased from 29.6% to 36.6% in 2016-17, 37.1% in both 2017-18 and 2018-19, to 37.7% in 2019-20, and to 38.4% in 2020-21. The other option “Another,” available in our HR system starting in December 2017, constituted less than 1% of faculty in each of the last three years.
5.2 Tenure Stream Faculty by Rank: Sex, Pattern Over Time to 2020-21
The proportion of tenured/tenure stream faculty who were female has increased across all three ranks since 2004-05. The proportion of faculty at the rank of Assistant and Associate Professor who were female was 47.3% and 45.2%, respectively, in 2020-21. The greatest gains in representation of females since 2004-05 were at the rank of Professor, where the proportion of females increased by 10.7%. However, the proportion of faculty at the rank of Professor who were female remained much lower than at the other two ranks in 2020-21 at 30.1% (a small increase from the previous few years and a substantial increase over 2004-05 when the percentage was 19.4%).
Figure 6: Tenure Stream Faculty by Rank, by Sex — Over Time to 2020-21
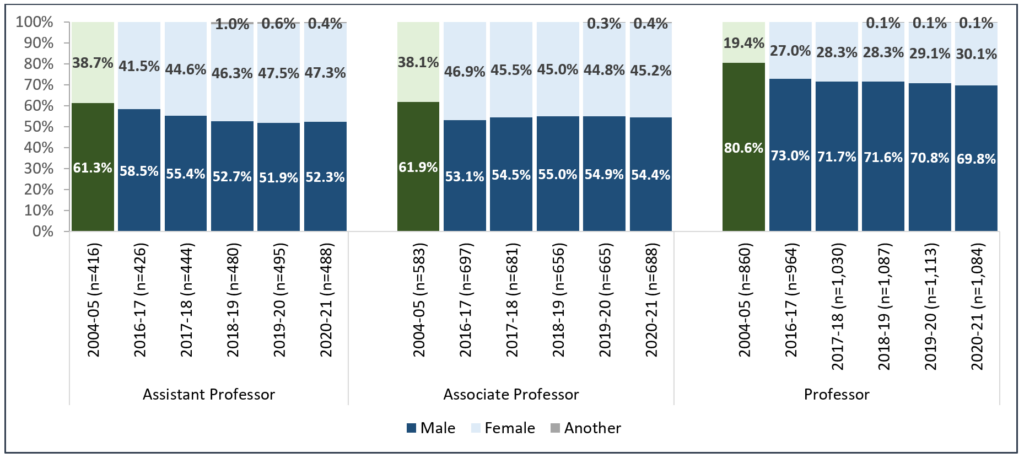
The stacked bar charts show the breakdown of tenured/tenure stream faculty by rank by sex. It uses the 2004-05 data as a baseline. Compared to baseline data, the proportion of faculty who were female has increased at all ranks: from 38.7% to 47.3% in 2020-21 for Assistant Professors; 38.1% to 45.2% in 2020-21 for Associate Professors; and 19.4% to 30.1% in 2020-21 for Professors.
5.3 Tenure Stream Faculty Who Were Female, by Rank: 2004-05 to 2020-21
The data used in the chart and table below are slightly different from that used above and were taken from the University’s Facts and Figures reports, which allows for the analysis of a longer time series. Although the trends reported on in previous sections are consistent with the Facts and Figures data (both share the same source — HRIS), the specific percentages reported in other sections may differ slightly due to a different set of exclusions applied to the data. The increase in the number of tenured/tenure stream faculty who were female since 2004-05 is also evident when we look at the percentage of faculty who were female by rank over time. Figure 7 shows:
- the increase in the proportion of faculty who were female across all three ranks over time;
- the rising but still comparatively lower percentage of faculty who were female at the highest rank of Professor.
Figure 7: Tenure Stream Faculty Who Were Female, by Rank, 2004-05 to 2020-21
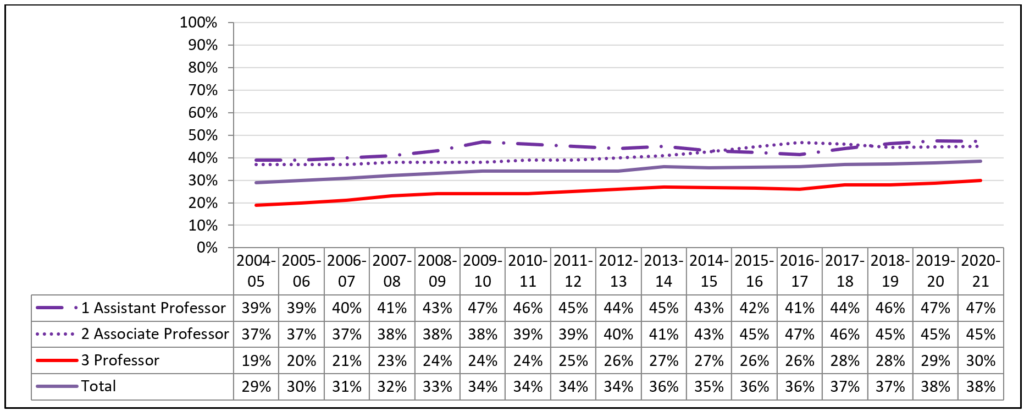
The line graph shows the percentage of tenured and tenure stream at each rank over time and for all three ranks combined. Between 2004-05 and 2020-21, the proportion of faculty at the rank of Assistant Professor who were female increased from 39% to 47%, the proportion of faculty at the rank of Associate Professor who were female increased from 37% to 45%, and the proportion of faculty at the rank of Professor who were female increased from 19% to 30%. The proportion of faculty at all three ranks combined who were female increased from 29% to 38%.
5.4 Tenure Stream Faculty by Sex, by Rank, 2020-21
Another way to look at the faculty complement is to compare the distribution of ranks by sex separately. This follows in Figure 8 below and shows that in 2020-21 only 37.6% of faculty who were female were at the rank of Professor versus 54.6% among faculty who were male. Only 16.7% of faculty who were another sex were at the rank of Professor, but these figures are small and should be interpreted with caution.
Figure 8: Tenure Stream Faculty by Sex, by Rank, 2020-21
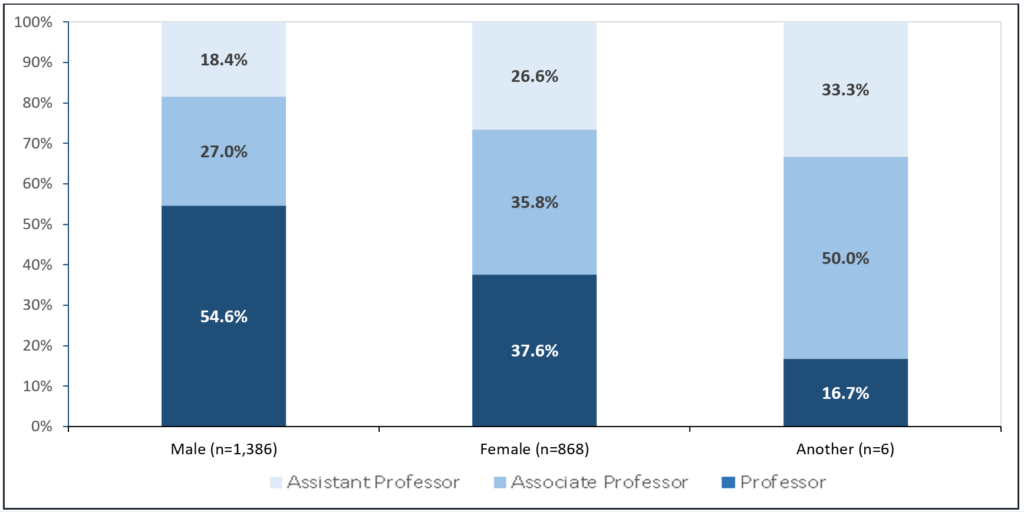
The three stacked bars show the distribution of faculty by sex and rank in 2020-21. Assistant Professors constituted 18.4% of faculty who were male, 26.6% of faculty who were female, and 33.3% of faculty who were another. Associate Professors constituted 27.0% of faculty who were male, 35.8% of faculty who were female, and 50.0% of faculty who were another sex. Professors constituted 54.6% of faculty who were male, 37.6% of faculty who were female, and 16.7% of faculty who were another sex.
6.1 Continuing Stream, Teaching Stream Faculty: by Sex, Pattern Over Time to 2020-21
Consistently, half of all continuing stream, teaching stream faculty at the University of Toronto have been female (as shown in the figure below).
Figure 9: Continuing Stream, Teaching Stream Faculty (All Ranks Combined) by Sex — Over Time to 2020-21
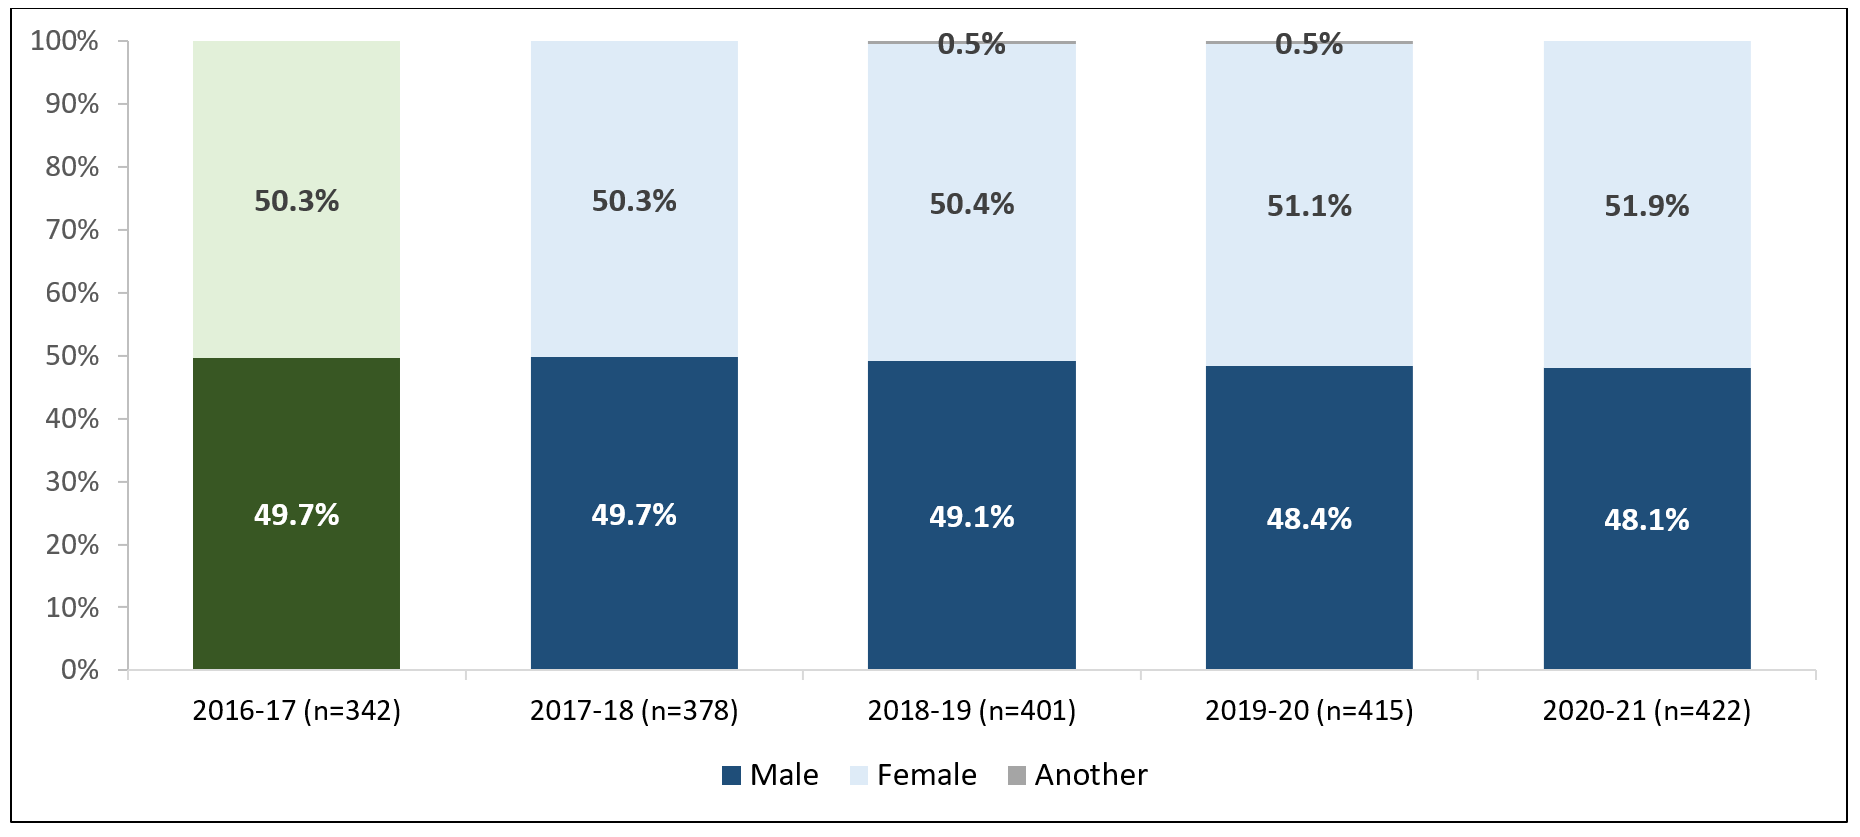
The stacked bar charts show the sex distribution of continuing stream, teaching stream faculty (all ranks). It uses 2016-17 data as a baseline. Compared to baseline data, the proportion of faculty who were female increased slightly from 50.3% in 2016-17 to 51.9% in 2020-21. In 2020-21, there were no faculty who were another sex.
6.2 Continuing Stream, Teaching Stream Faculty by Rank: Sex, Pattern Over Time to 2020-21
The percentage of continuing stream, teaching stream faculty at the rank of Assistant Professor, Teaching Stream who were female was 56.8%; at the rank of Associate Professor, Teaching Stream the proportion was slightly lower at 49.0% of faculty who were female. The rank of Professor, Teaching Stream was first established effective January 2016. The first faculty were promoted to the new rank in 2018-19 following approval of the Policy and Procedures Governing Promotion in the Teaching Stream. The number of continuing stream, teaching stream faculty at the rank of Professor, Teaching Stream has increased significantly over the past few years since the Policy and Procedures Governing Promotion in the Teaching Stream was approved in 2016. Any change in the percentage of teaching stream faculty at this rank who are female should be interpreted with caution.
Figure 10: Continuing Stream, Teaching Stream Faculty by Rank, by Sex — Over Time to 2020-21
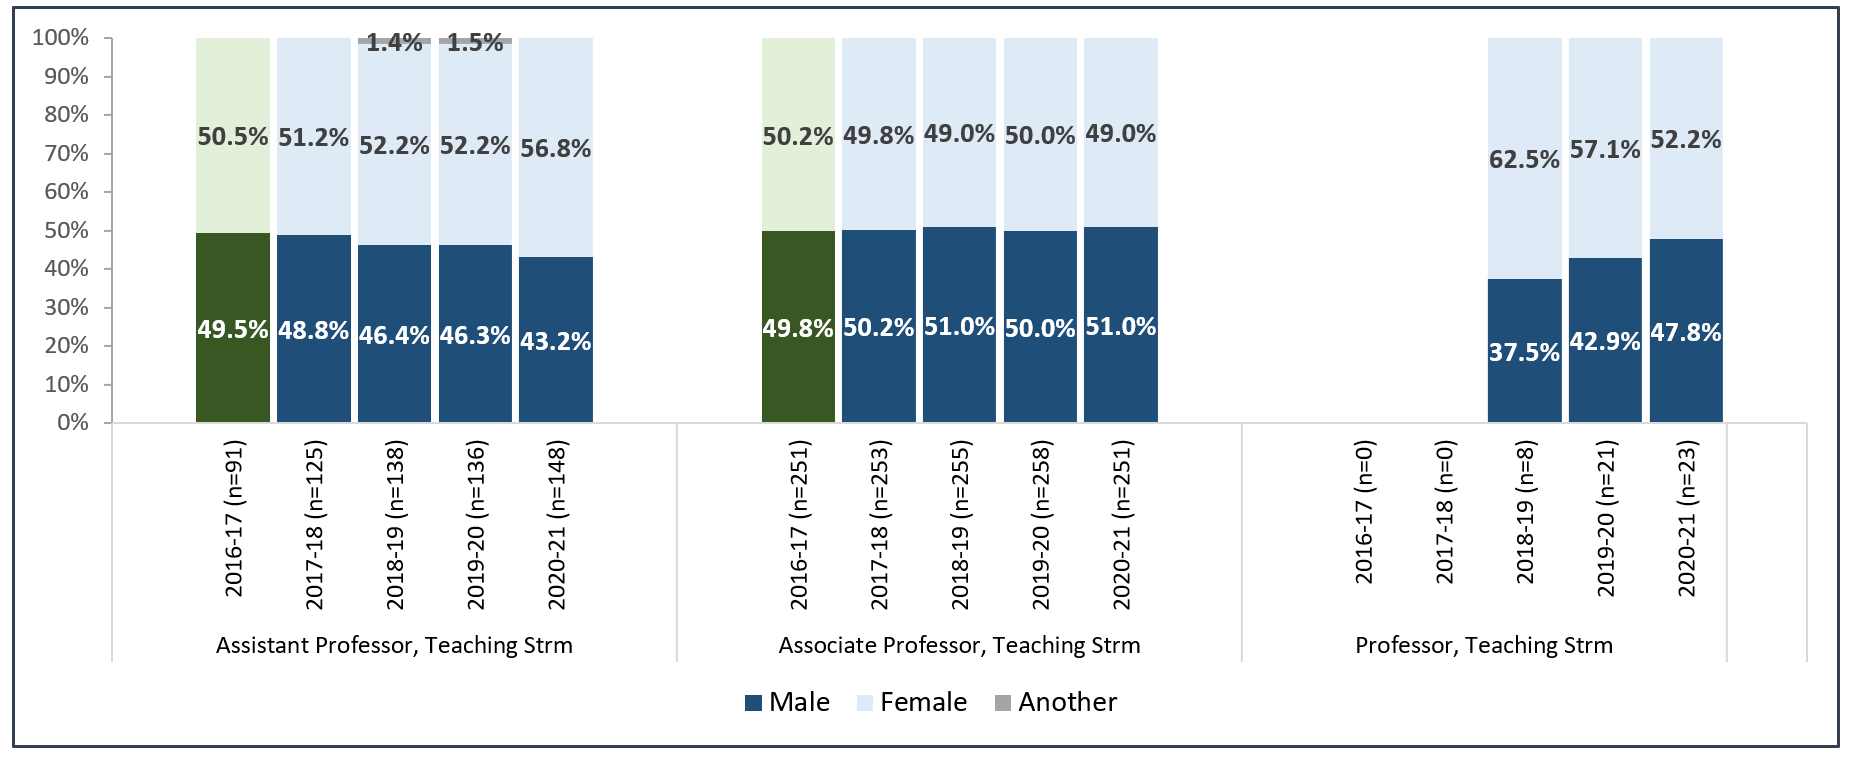
The stacked bar charts show the breakdown of continuing stream, teaching stream faculty positions by rank, by sex. It uses 2016-17 data as a baseline. At the rank of Assistant Professor, Teaching Stream the proportion of faculty who were female increased from 50.5% in 2016-17 to 56.8% in 2020-21. The proportion of faculty who were another sex at the rank of Assistant Professor, Teaching Stream decreased from 1.5% in 2019-20 to 0 in 2020-21; there is no baseline data for this category. At the rank of Associate Professor, Teaching Stream, the proportion of faculty who were female remained fairly constant around 50%, ranging from 49.0% in 2018-19 and 2020-21 to 50.2% in 2016-17. There were very few faculty at the new rank of Professor, Teaching Stream; 62.5% of these faculty in 2018-19 (n= 8) were female compared to 52.2% in 2020-21 (n= 23).
Strm = stream.
6.3 Continuing Stream, Teaching Stream Faculty by Sex, by Rank
Another way to look at the faculty complement is to compare the distribution of ranks by sex separately. There is little difference in terms of rank distribution by sex. In 2020-21, 63.1% of faculty who were male in the teaching stream were at the rank of Associate Professor, Teaching Stream, compared to 56.2% of faculty who were female. Once again, the number of faculty at the rank of Professor, Teaching Stream is very small, reflecting the fact that the first faculty were promoted to this rank in 2018-19.
Figure 11: Continuing Stream, Teaching Stream Faculty by Sex, by Rank, 2020-21
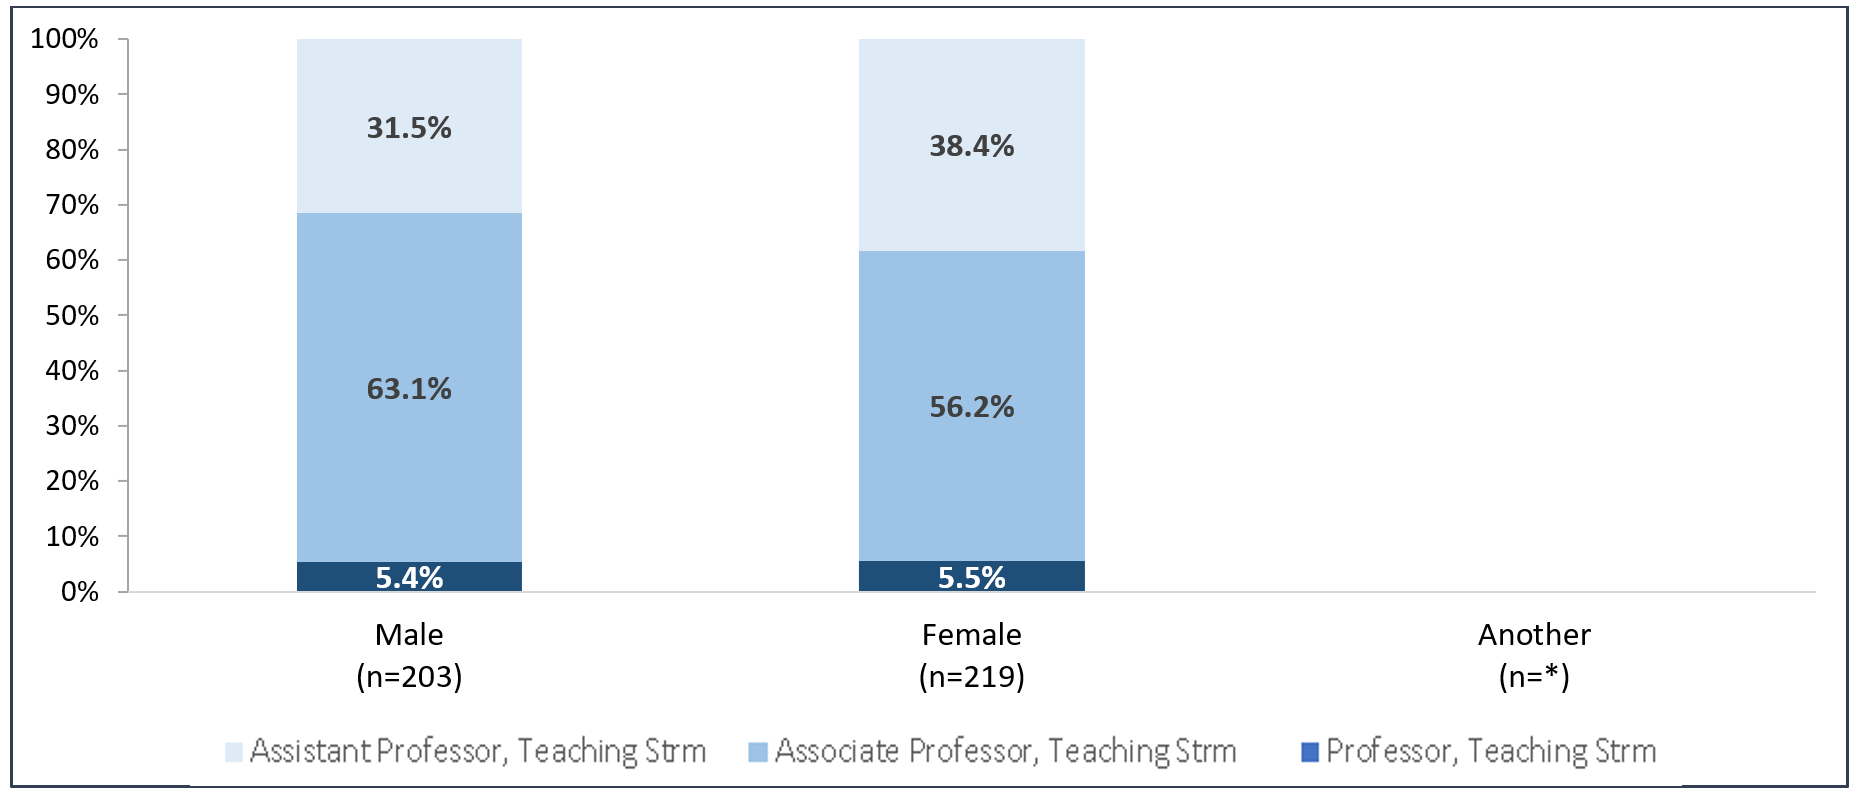
*Not reported due to cell size less than three.
The two stacked bars show the distribution of continuing stream, teaching stream faculty by sex, by rank in 2020-21. The proportion of males and females at each rank are comparable. Assistant Professors, Teaching Stream constituted 38.4% of all faculty who were female and they constituted 31.5% of all faculty who were male. Associate Professors, Teaching Stream constituted 56.2% of all faculty who were female in that category; they constituted 63.1% of all faculty who were male. The proportion of female and male faculty who were at the rank of Professor, Teaching Stream was 5.5% and 5.4%, respectively.
A time series showing additional years of data for the continuing stream, teaching stream, similar to that reported for the tenured/tenure stream in Figure 7 is not available. Continuing stream, teaching stream appointments were only identifiable in our HR information system starting in 2016, hence the data reported in Figures 9 and 10 is a complete time series.
Strm = stream.
7.1 Permanent Status and Permanent Status Stream Librarians: by Sex, Pattern Over Time to 2020-21
The majority of permanent status/permanent status stream Librarians at the University of Toronto have been female. Since the availability of the option to select a third sex option in December 2017, there have not been any permanent status/permanent status stream Librarians who were another sex.
Figure 12: Permanent Status and Permanent Status Stream Librarians (All Ranks Combined) by Sex — Over Time to 2020-21
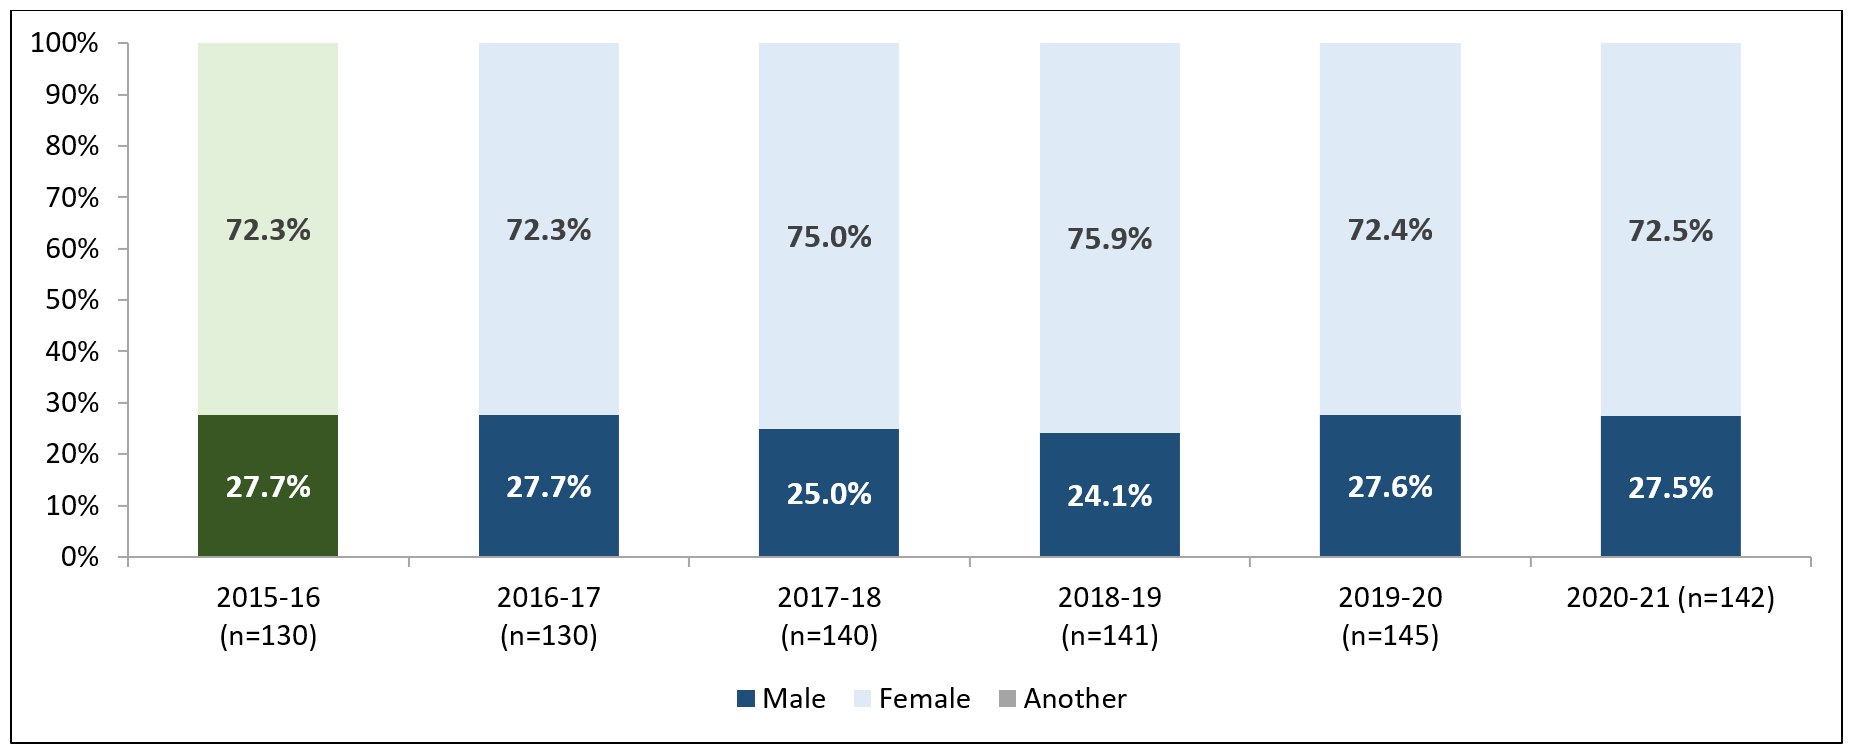
The stacked bar chart shows the sex distribution of permanent status and permanent status stream librarians (all ranks). It uses 2015-16 data as a baseline. Compared to baseline data, the proportion of librarians who were female increased slightly from 72.3% in 2015-16 to 72.5% in 2020-21.
7.2 Permanent Status and Permanent Status Stream Librarians by Rank: by Sex, Pattern Over Time to 2020-21
The proportion of librarians who were female at the rank of Librarian I, the most junior rank, has historically been the most volatile as there have been relatively few librarians at this rank. At the rank of Librarian II, the proportion of librarians who were female decreased significantly from the baseline year in which 93.8% of librarians were female but has since remained a fairly constant proportion, ranging from 72.2% to 78.6%. The career rank for librarians is the rank of Librarian III. A fairly consistent proportion of librarians at this rank were female, ranging from 74.1% to 78.3%. The number of Librarians at the rank of Librarian IV has been quite small. At that rank, the breakdown between the sexes was close to equal in most years.
Figure 13: Permanent Status and Permanent Status Stream Librarians by Rank, by Sex — Over Time to 2020-21
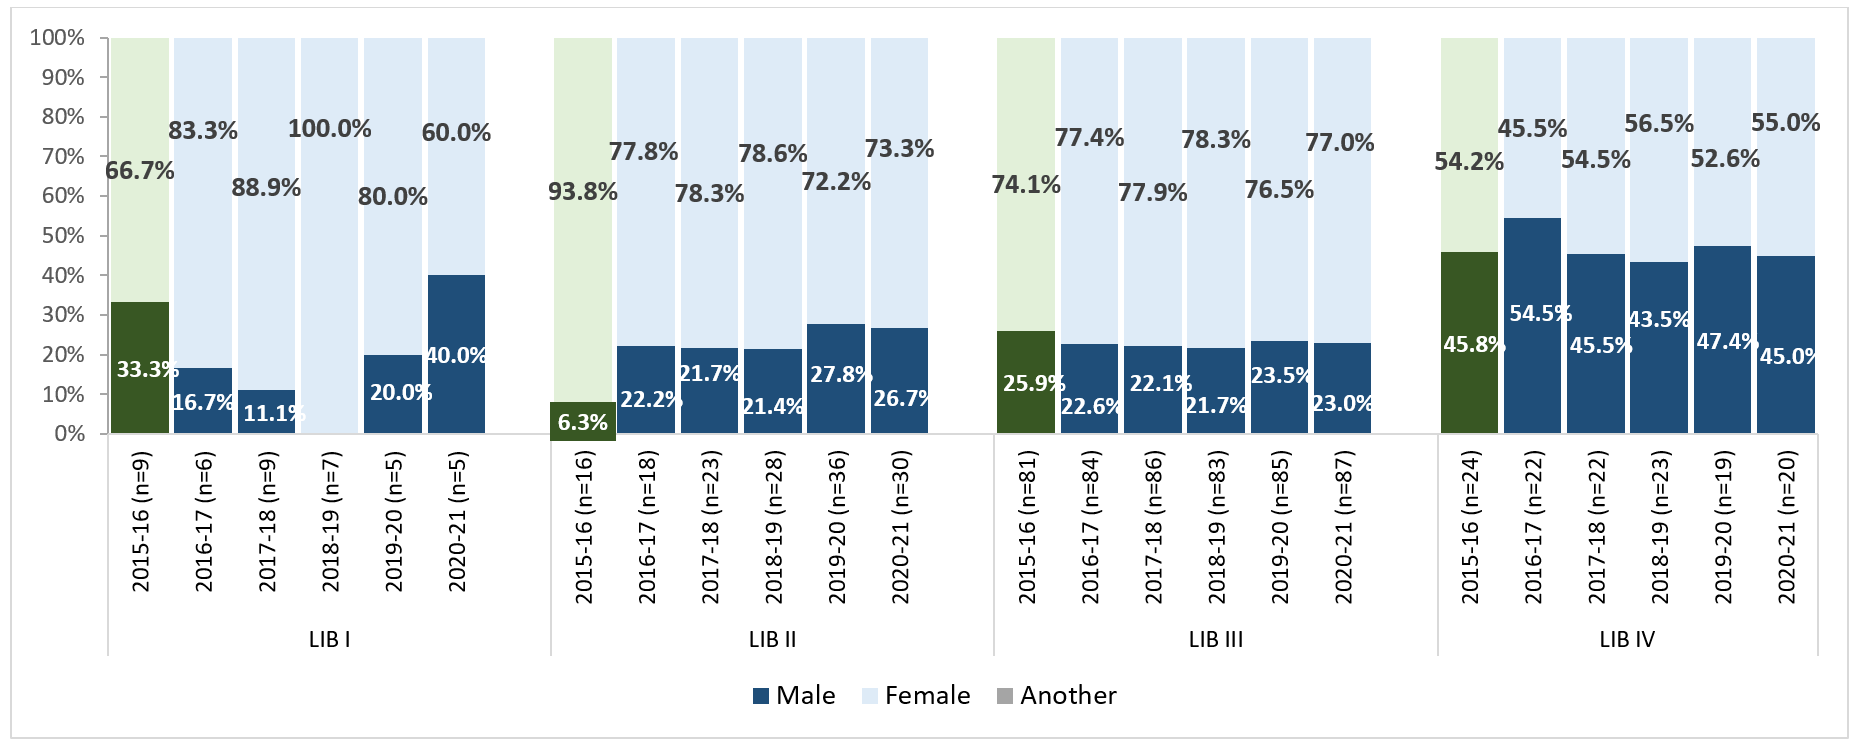
The stacked bar charts show the breakdown of permanent status and permanent status stream librarian positions by rank and by sex. It uses the 2015-16 data as a baseline. At the rank of Librarian I, the proportion of librarians who were female decreased from 66.7% in 2015-16 to 60.0% in 2020-21. At the rank of Librarian II, the proportion of librarians who were female declined from 93.8% in 2015-16 to 73.3% in 2020-21. At the rank of Librarian III, the proportion of librarians who were female increased from 74.1% in 2015-16 to 77.0% in 2020-21. At the rank of Librarian IV, the proportion of librarians who were female varied over time, increasing slightly from 54.2% in 2015-16 to 55.0% in 2020-21.
7.3 Permanent Status and Permanent Status Stream Librarians by Sex by Rank, 2020-21
Looking at the distribution of librarian ranks among each sex shows that while librarians who were female were far greater in number, the distribution of the ranks was somewhat even between the two sexes by which librarians were represented. The largest difference was at the ranks of Librarian III and IV. For both sexes, about three quarters of the librarians were at these ranks. Of librarians who were male, 23.1% were at the rank of Librarian IV; of Librarians who were female, 10.7% of Librarians who were at the rank of Librarian IV despite there being more females in total at that rank when compared to males (the number of librarians who were male was considerably lower overall). In 2020-21, no librarians were another sex.
Figure 14: Permanent Status and Permanent Status Stream Librarians by Sex, by Rank, 2020-21
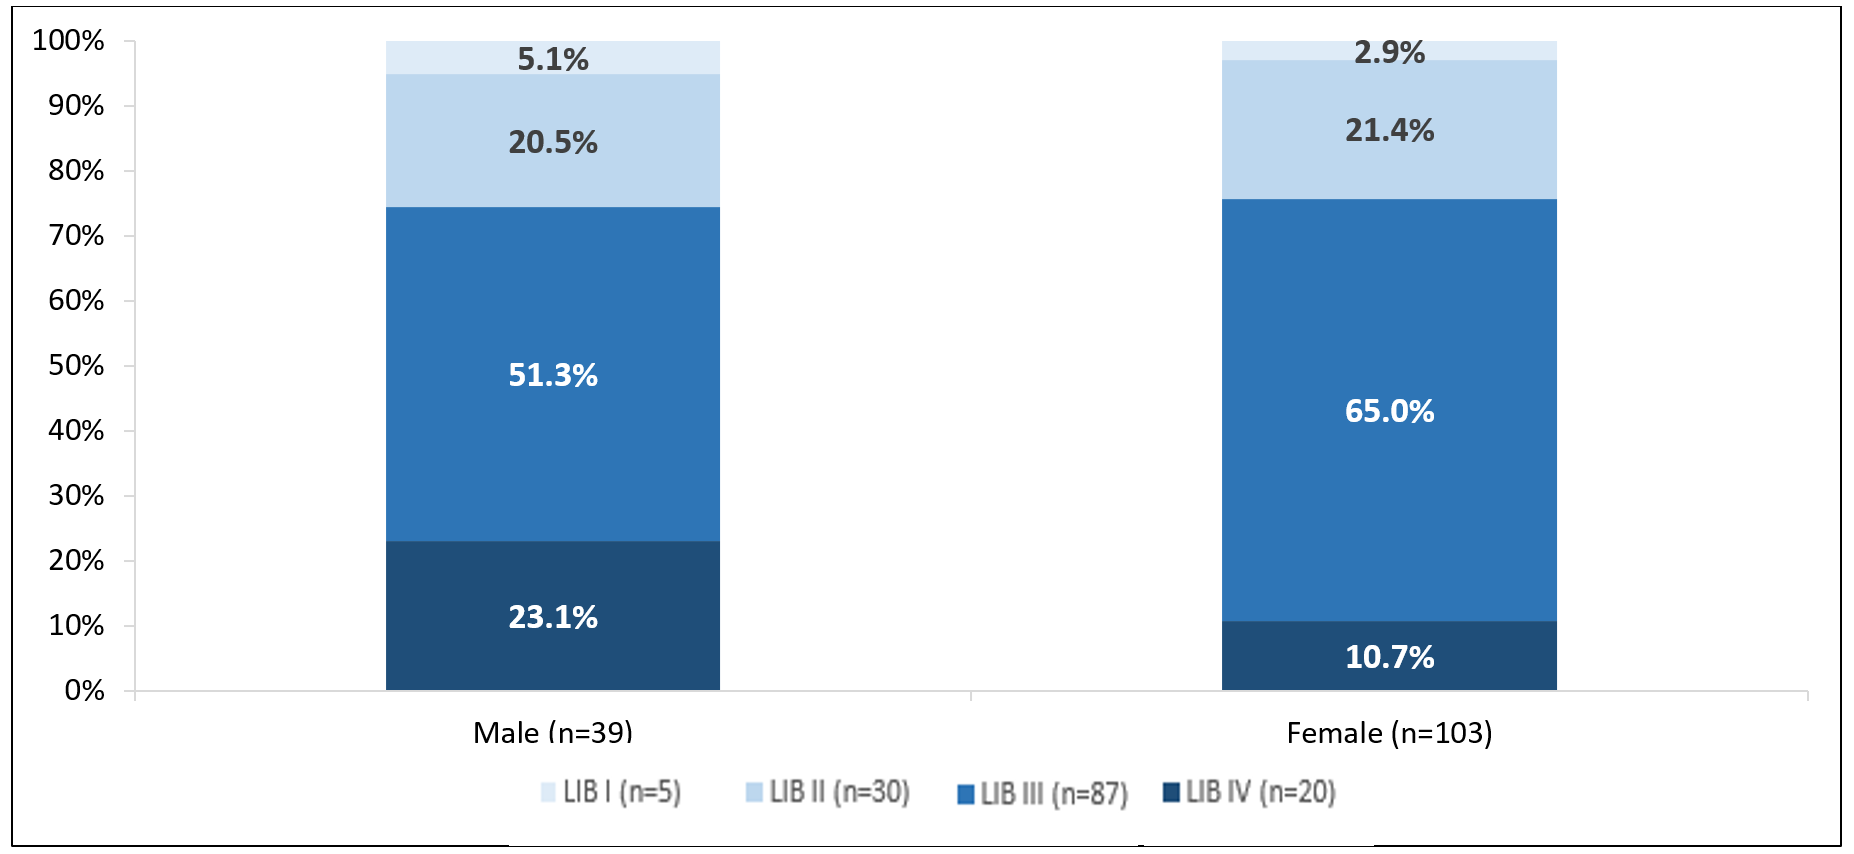
The two stacked bars show the distribution of librarians by sex and rank in 2020-21. Librarians at the rank of Librarian I constituted 5.1% of librarians who were male and 2.9% of librarians who were female. Librarians at the rank of Librarian II constituted 20.5% of Librarians who were male and 21.4% of Librarians who were female. Librarians at the rank of Librarian III constituted 51.3% of librarians who were male and 65.0% of librarians who were female. Librarians at the rank of Librarian IV constituted 23.1% of librarians who were male and 10.7% of librarians who were female. There were no Librarians who were another sex in 2020-21.
LIB = librarian.
8.1 Tenure Stream Faculty: Percentage Female Over Time to 2020-21
The following table shows the percentage of faculty who were female by Faculty8, by year. Appendix A includes a breakdown by Faculty by academic unit. In Appendix B and C there are breakdowns by rank by Faculty for 2020-21.
Table 1: Percentage of Tenure Stream Faculty Who Were Female by Faculty (All Ranks Combined) — Over Time to 2020-219
| Faculty | 2004-05 % | 2014-15 % | 2015-16 % | 2016-17 % | 2017-18 % | 2018-19 % | 2019-20 % | 2020-21 % | 2020-21 Total N |
|---|---|---|---|---|---|---|---|---|---|
| Applied Science and Engineering, Faculty of | 8% | 17% | 18% | 20% | 20% | 20% | 20% | 20% | 243 |
| Architecture, Landscape, and Design, John H. Daniels, Faculty of | 8% | 44% | 44% | 48% | 43% | 46% | 36% | 31% | 29 |
| Arts and Science, Faculty of | 27% | 34% | 34% | 35% | 36% | 36% | 37% | 37% | 761 |
| Dentistry, Faculty of | 17% | 35% | 30% | 32% | 34% | 33% | 34% | 35% | 37 |
| Information, Faculty of | 64% | 50% | 52% | 52% | 50% | 52% | 50% | 50% | 24 |
| Kinesiology and Physical Education, Faculty of | 36% | 33% | 32% | 32% | 32% | 41% | 44% | 48% | 25 |
| Law, Faculty of | 36% | 42% | 40% | 40% | 42% | 41% | 41% | 42% | 52 |
| Management, Rotman School of | 15% | 19% | 18% | 19% | 18% | 21% | 22% | 23% | 111 |
| Medicine, Temerty Faculty of | 31% | 38% | 39% | 39% | 39% | 37% | 37% | 37% | 160 |
| Music, Faculty of | 32% | 38% | 40% | 39% | 41% | 39% | 44% | 45% | 33 |
| Nursing, Lawrence S. Bloomberg Faculty of | 95% | 94% | 91% | 91% | 90% | 85% | 88% | 87% | 23 |
| Ontario Institute for Studies in Education | 59% | 63% | 63% | 64% | 64% | 67% | 66% | 63% | 93 |
| Pharmacy, Leslie Dan Faculty of | 36% | 45% | 48% | 47% | 50% | 50% | 48% | 48% | 29 |
| Public Health, Dalla Lana School of10 | 54% | 53% | 50% | 50% | 51% | 51% | 54% | 59% | 41 |
| Social Work, Factor-Inwentash Faculty of | 64% | 63% | 63% | 65% | 69% | 70% | 69% | 68% | 31 |
| University of Toronto Mississauga | 28% | 35% | 37% | 36% | 36% | 37% | 37% | 40% | 306 |
| University of Toronto Scarborough | 29% | 37% | 39% | 39% | 40% | 40% | 40% | 41% | 262 |
| Total | 30% | 35% | 36% | 37% | 37% | 37% | 38% | 38% | 2,260 |
8 Faculty refers to the academic unit in which the faculty member held their majority budgetary appointment. For faculty members who held budgetary cross-appointments, only the majority appointment information is reported. Some faculty members serve as academic administrators in other Faculties; this information is not reflected in the data.
9 Starting in 2018-19, data includes tenured faculty with a reduced (part-time) FTE; prior to then, data excluded part-time tenured faculty unless they were on phased retirement. Academic units with at least 10 faculty members are reported in the table above; the only Faculty excluded above is Forestry; this Faculty was closed July 1, 2019 and faculty members were reassigned to other Faculties, most notably to Architecture. The “Total” includes data from all Faculties, regardless of the reporting threshold.
10 Public Health and the Institute of Health Policy, Management and Evaluation were part of the Faculty of Medicine in 2004-05. They have been reported separately as the School of Public Health, Dalla Lana for 2004-05 for the purpose of this comparison.
8.2 Continuing Stream, Teaching Stream Faculty: Percentage Female Over Time to 2020-21
The University of Toronto employs a relatively small number of teaching stream faculty (n=422 in 2020-21). Their distribution by Faculty has been uneven. The table below reports information only for those Faculties that had at least 10 teaching stream faculty. In Appendix D and E there are breakdowns by rank by Faculty for 2020-21. There are no breakdowns by Faculty by academic unit for teaching stream faculty because of the comparatively small numbers.
Table 2: Percentage of Continuing Stream, Teaching Stream Faculty Who Were Female by Faculty (All Ranks Combined) — Over Time to 2020-2111
| Faculty | 2016-17 % | 2016-17 % | 2018-19 % | 2019-20 % | 2020-21 % | 2020-21 Total N |
|---|---|---|---|---|---|---|
| Applied Science and Engineering, Faculty of | 23% | 35% | 32% | 32% | 30% | 27 |
| Arts and Science, Faculty of | 44% | 43% | 44% | 45% | 48% | 112 |
| Management, Rotman School of | 46% | 50% | 50% | 50% | 47% | 15 |
| Medicine, Temerty Faculty of | 88% | 94% | 95% | 91% | 92% | 24 |
| Music, Faculty of | 15% | 15% | 21% | 23% | 23% | 13 |
| Nursing, Lawrence S. Bloomberg Faculty of | 100% | 91% | – | – | – | – |
| Ontario Institute for Studies in Education | 58% | 57% | 62% | 67% | 64% | 14 |
| University of Toronto Mississauga | 42% | 39% | 37% | 37% | 41% | 80 |
| University of Toronto Scarborough | 59% | 57% | 60% | 59% | 57% | 93 |
| Total | 50% | 50% | 50% | 51% | 52% | 422 |
11 Academic units with at least 10 faculty members are reported in the table above; the symbol “-“ used in the chart above indicates that data could not be reported as it did not reach this threshold. Starting in 2018-19, data includes continuing stream, teaching stream faculty with a reduced full-time equivalent (FTE); prior to then data only included full-time, continuing status, and continuing stream, teaching stream, unless they were on phased retirement. The “Total” includes data from all Faculties, regardless of the reporting threshold.
This section reports only on tenured faculty who were in academic leadership roles. Because of the nature of many of these roles, only a minority can be performed by teaching stream faculty.
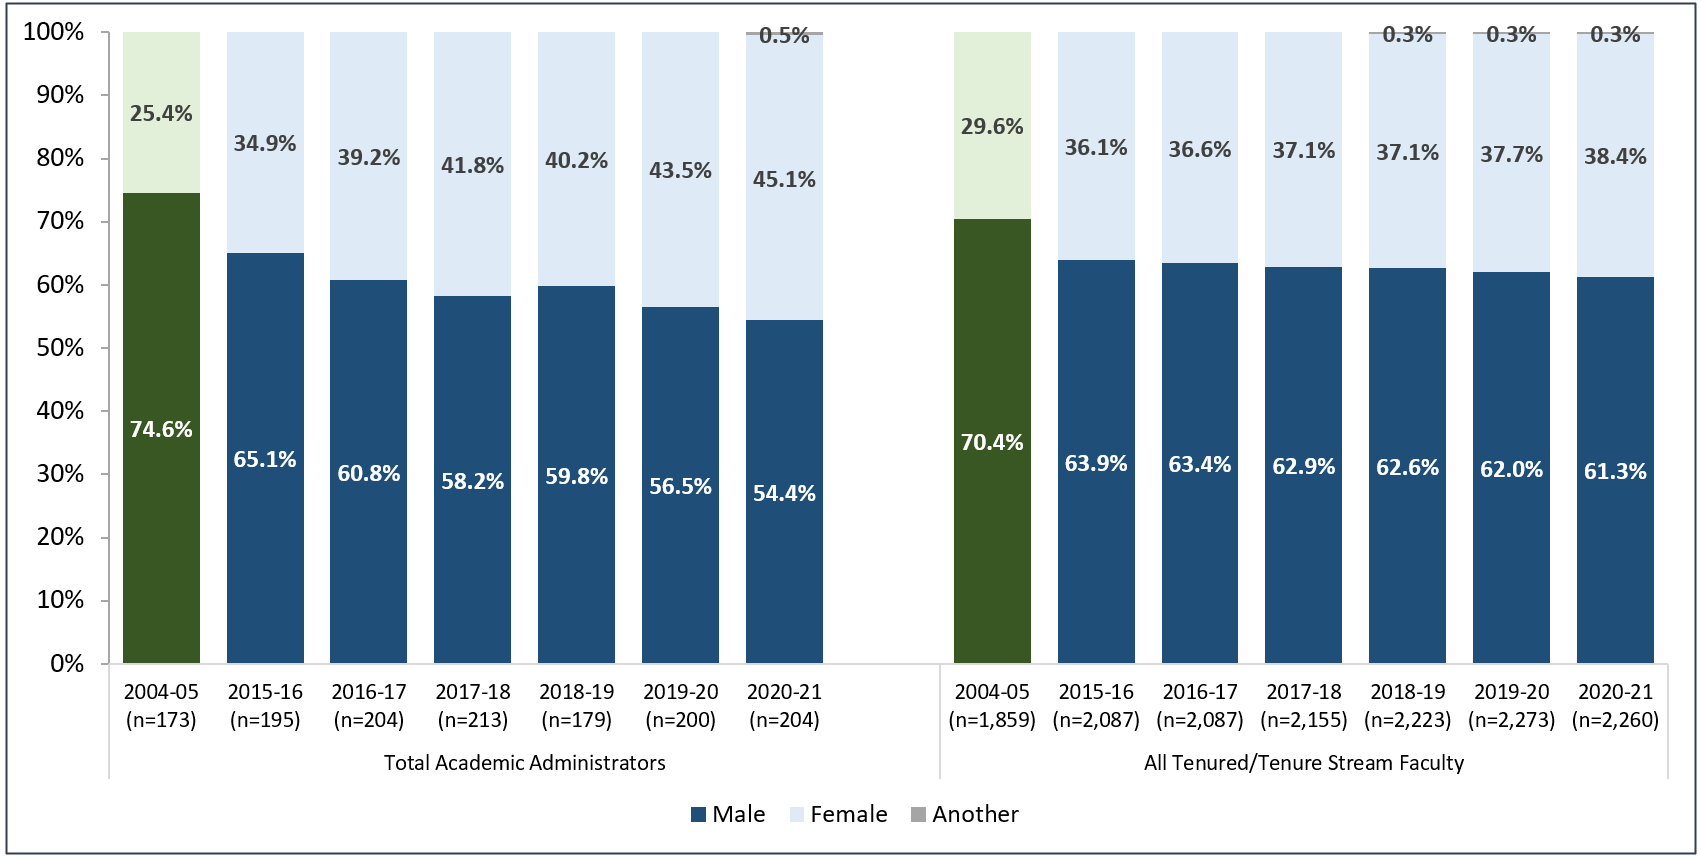
The proportion of tenured faculty in academic leadership positions at the University who were female steadily increased since 2004-05. In 2020-21, 45.1% of all academic administrators at the level of chair/director and above at U of T were female, up from 25.4% in 2004-05. The proportion of academic administrators who were female exceeds their representation of the tenured/tenure stream population, from which most Academic Administrators are drawn: 45.1% as opposed to 38.4% in 2020-21.
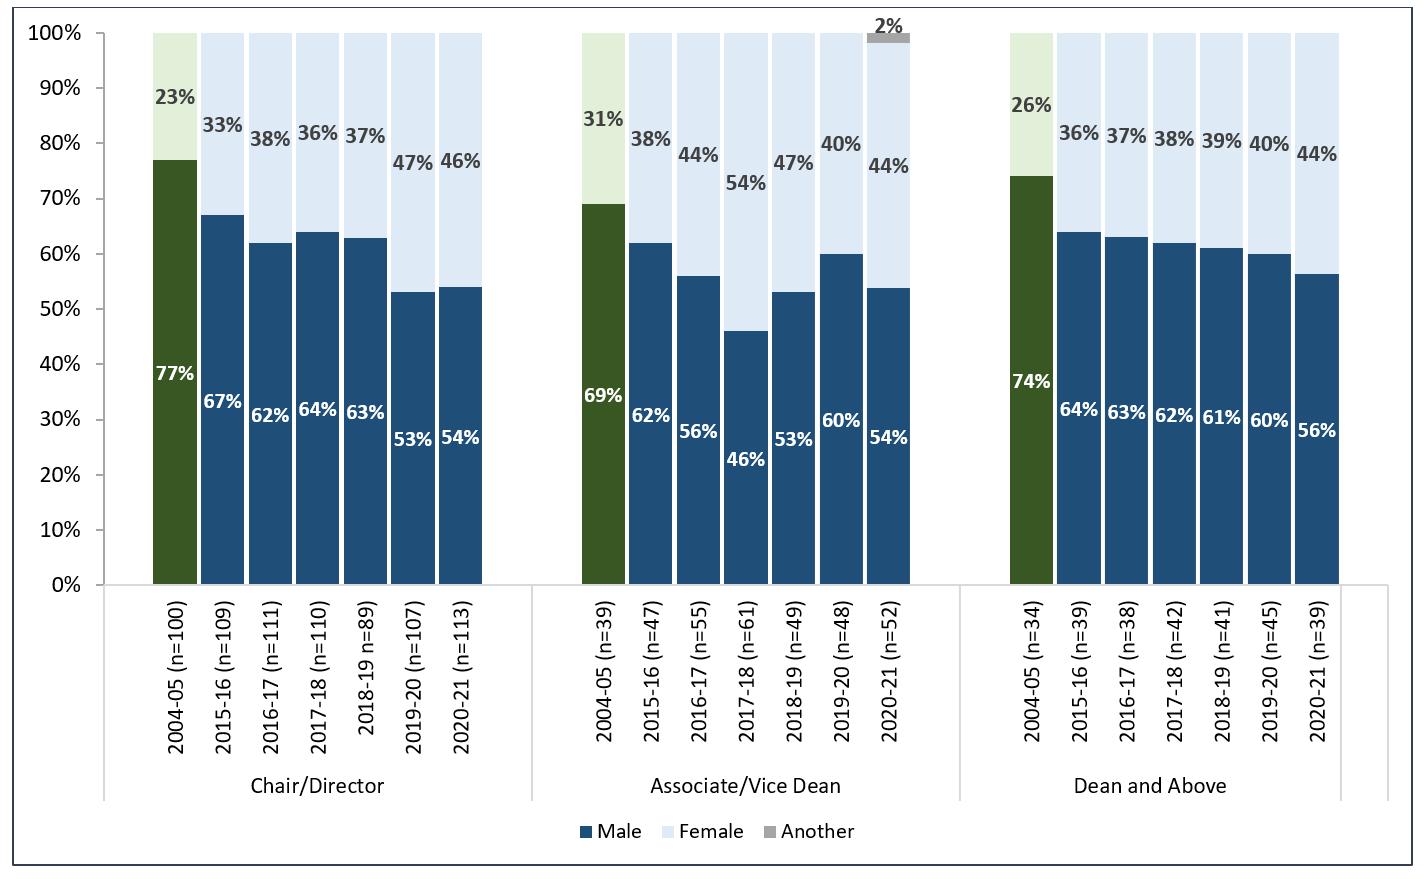
The proportion of faculty who held academic administrative positions at U of T who were female rose over the last 17 years. This is the case across all levels, but particularly at the level of “Chair/Director” where 46% of all those holding such positions were female in 2020-21, up from 23% in 2004-05. In 2020-21 for the first time, we see “another” sex represented among the Academic Leadership, at 2% of Associate/Vice Dean positions.
It is important to keep in mind that the total number of positions within each category such as “Associate/Vice Dean” and “Dean and Above” are relatively small. Thus, small changes in the number of each sex serving in these roles can have a relatively large impact on percentage counts.
Figure 15: Leadership Positions: Breakdown by Sex Compared to Total Tenured/Tenure Stream Faculty Counts — Over Time to 2020-2112
12 The analysis includes: (1) Academic administrators appointed under the Policy on Appointment of Academic Administrators (PAAA); and (2) Leaders who were members of the PVP group, which includes faculty serving in the most senior roles including President, Vice-Presidents, and Vice-Provosts. Academic administrators in acting and interim positions are included in the analysis. As a result, for some positions, both acting and the incumbent administrators are counted.
The first stacked bar series shows the breakdown of faculty serving in academic administrator positions by sex; the second shows the total population of tenured/tenure stream faculty for comparison. In the baseline year, 2004-05, 29.6% of the tenured/tenure stream complement were female. At the same time, 25.4% of academic administrators were female. Faculty who were male comprised 70.4% of the population and held 74.6% of the administrative positions. Since 2004-05, the proportion of academic administrators who were female grew from 25.4% to 45.1% and the proportion of faculty who were another sex has grown from 0 to 0.5% in 2020-21. In 2020-21, 38.4% of tenured/tenure stream faculty were female and 0.3% were another sex.
Figure 16: Leadership Positions by Position Type: Breakdown by Sex — Over Time to 2020-2113
13 “Dean and Above” category includes members of PVP (President, Vice-Presidents, and Vice-Provosts). Academic administrators in acting and interim positions are included in the analysis. As a result, for some positions, both acting and the incumbent administrators are counted.
The stacked bar graph shows the breakdown of academic administrator positions by position type, by sex. There are three position types for academic administrative roles: Chair/Director; Associate/Vice Dean; and Dean and Above. Data from the baseline year, 2004-05, are compared to more recent data from 2015-16 through to 2020-21. In all three categories, the proportion of leaders who were female increased over time. At the level of Chair/Director, the proportion of leaders who were female increased from 23% in 2004-05 to 46% 2020-21; at the level of Associate/Vice Dean, the proportion of leaders who were female varied year-over-year and increased from 31% in 2004-05 to 44% in 2020-21; at the level of Dean and Above, the proportion of leaders who were female increased from 26% in 2004-05 to 44% in 2020-21. In 2020-21 2% of Academic Administrators, all at the level of Associate/Vice Dean, were another sex.
How to interpret this table: This shows a time series of the percentage of faculty who were female in the overall faculty complement14 for each respective academic unit by year, compared to the 2004-05 baseline. The final two columns show the percentage of faculty who were female in 2020-21 and the total count of all tenured/tenure stream faculty, by academic unit.
| Academic Home Org Unit | 2004-05 % | 2016-17 % | 2017-18 % | 2018-19 % | 2019-20 % | 2020-21 % | 2020-21 Total N |
|---|---|---|---|---|---|---|---|
| Applied Science and Engineering, Faculty of | |||||||
| Aerospace Studies, Institute for (EDU:A) | 0% | 13% | 13% | 13% | 13% | 12% | 17 |
| Biomaterials and Biomedical Engineering, Institute of (EDU:A) | – | 33% | 36% | 36% | 31% | 29% | 14 |
| Chemical Engineering and Applied Chemistry, Department of | 15% | 28% | 27% | 28% | 28% | 29% | 28 |
| Civil and Mineral Engineering, Department of | 10% | 28% | 27% | 27% | 26% | 27% | 41 |
| Electrical and Computer Engineering, Edward S. Rogers Department of | 7% | 10% | 10% | 10% | 10% | 11% | 75 |
| Materials Science and Engineering, Department of | 0% | 14% | 20% | 19% | 24% | 19% | 16 |
| Mechanical and Industrial Engineering, Department of | 8% | 24% | 25% | 22% | 24% | 25% | 52 |
| Architecture, Landscape and Design15, John H. Daniels Faculty of | 8% | 48% | 43% | 46% | 36% | 31% | 29 |
| Arts and Science, Faculty of | |||||||
| Anthropology, Department of | 33% | 43% | 43% | 46% | 52% | 54% | 28 |
| Art History, Department of16 | 33% | 38% | 43% | 43% | 43% | 40% | 15 |
| Astronomy and Astrophysics, Department of | – | 17% | 17% | 23% | 29% | 33% | 15 |
| Biology17 | 33% | 29% | 31% | 30% | 33% | 35% | 49 |
| Cell and Systems Biology, Department of | N/A | 22% | 25% | 23% | 25% | 26% | 27 |
| Ecology and Evolutionary Biology, Department of | N/A | 36% | 38% | 38% | 43% | 45% | 22 |
| Chemistry, Department of | 11% | 23% | 22% | 20% | 20% | 18% | 33 |
| Classics, Department of | 13% | 17% | 21% | 29% | 25% | 25% | 16 |
| Computer Science, Department of | 21% | 29% | 27% | 30% | 29% | 26% | 46 |
| Earth Sciences, Department of | 17% | 43% | 46% | 41% | 47% | 43% | 14 |
| East Asian Studies, Department of | 27% | 46% | 46% | 46% | 54% | 54% | 13 |
| Economics, Department of | 15% | 11% | 11% | 11% | 13% | 18% | 40 |
| English, Department of | 45% | 44% | 45% | 47% | 48% | 44% | 43 |
| French, Department of | 33% | 36% | 46% | 46% | 45% | 50% | 10 |
| Geography and Planning, Department of | 36% | 41% | 38% | 37% | 43% | 41% | 29 |
| Global Affairs and Public Policy, Munk School of (EDU:A)18 | N/A | – | – | – | 20% | – | – |
| History, Department of | 30% | 49% | 51% | 48% | 48% | 51% | 41 |
| History and Philosophy of Science and Technology, Inst for the (EDU:A) | – | – | – | – | – | 30% | 10 |
| Linguistics, Department of | – | 70% | – | 60% | 64% | 67% | 12 |
| Mathematics, Department of | 11% | 14% | 14% | 16% | 18% | 16% | 38 |
| Near and Middle Eastern Civilizations, Department of | 36% | 38% | 38% | 36% | 36% | 43% | 14 |
| Philosophy, Department of | 31% | 32% | 33% | 33% | 29% | 31% | 26 |
| Physics, Department of | 8% | 22% | 19% | 16% | 18% | 18% | 40 |
| Political Science, Department of | 26% | 43% | 44% | 40% | 38% | 44% | 41 |
| Psychology, Department of | 30% | 46% | 52% | 52% | 56% | 52% | 27 |
| Religion, Department for the Study of | 21% | 50% | 50% | 53% | 50% | 50% | 20 |
| Slavic Languages and Literatures, Department of | – | – | 64% | – | – | – | – |
| Sociology, Department of | 36% | 46% | 46% | 48% | 50% | 50% | 26 |
| Spanish and Portuguese, Department of | 33% | 75% | 75% | 75% | 69% | 69% | 13 |
| Statistical Sciences, Department of | 10% | 14% | 14% | 25% | 31% | 38% | 21 |
| Dentistry, Faculty of | 17% | 32% | 34% | 33% | 34% | 35% | 37 |
| Information, Faculty of | 64% | 52% | 50% | 52% | 50% | 50% | 24 |
| Kinesiology and Physical Education, Faculty of | 36% | 32% | 32% | 41% | 44% | 48% | 25 |
| Law, Faculty of | 36% | 40% | 42% | 41% | 41% | 42% | 52 |
| Management, Joseph L. Rotman School of | 15% | 19% | 18% | 21% | 22% | 23% | 111 |
| Medicine, Temerty Faculty of19 | |||||||
| Biochemistry, Department of | 20% | 7% | 11% | 12% | 12% | 12% | 17 |
| Cellular and Biomolecular Research, Terrence Donnelly Centre for (EDU:A) | 6% | 6% | 6% | 6% | 6% | 18 | |
| Laboratory Medicine and Pathobiology, Department of | 14% | 21% | 15% | 14% | 13% | 13% | 15 |
| Molecular Genetics, Department of | 26% | 32% | 30% | 30% | 30% | 27% | 22 |
| Nutritional Sciences, Department of | – | – | 40% | 36% | 45% | 50% | 12 |
| Occupational Science and Occupational Therapy, Department of | – | – | 90% | 90% | 85% | 79% | 14 |
| Pharmacology and Toxicology, Department of | – | – | 40% | 40% | 40% | 40% | 10 |
| Physical Therapy, Department of | – | – | 92% | 91% | 90% | 91% | 11 |
| Physiology, Department of | 29% | 40% | 44% | 40% | 40% | 36% | 14 |
| Music, Faculty of | 32% | 39% | 41% | 39% | 44% | 45% | 33 |
| Nursing, Lawrence S. Bloomberg Faculty of | 96% | 91% | 90% | 85% | 88% | 87% | 23 |
| Ontario Institute for Studies in Education (OISE)20 | |||||||
| Applied Psychology and Human Development, Department of | 60% | 68% | 71% | 68% | 64% | 63% | 24 |
| Curriculum, Teaching and Learning, Department of | 59% | 65% | 62% | 64% | 62% | 57% | 35 |
| Leadership, Higher and Adult Education, Department of | 52% | 58% | 61% | 67% | 70% | 65% | 23 |
| Social Justice Education, Department of | 69% | 69% | 64% | 71% | 73% | 82% | 11 |
| Pharmacy, Leslie L. Dan Faculty of | 36% | 47% | 50% | 50% | 48% | 48% | 29 |
| Public Health, Dalla Lana School of21 | 54% | 50% | 51% | 51% | 54% | 59% | 41 |
| Social Work, Factor-Inwentash Faculty of | 64% | 65% | 69% | 70% | 69% | 68% | 31 |
| University of Toronto Mississauga (UTM) | |||||||
| Anthropology, Department of | – | 46% | 47% | 47% | 47% | 50% | 18 |
| Biology, Department of | 14% | 29% | 30% | 29% | 29% | 28% | 29 |
| Chemical and Physical Sciences22, Department of | 13% | 18% | 21% | 26% | 28% | 29% | 17 |
| Communication, Culture, Information and Technology, Institute of (EDU:A) | – | 45% | 45% | 40% | 57% | 60% | 15 |
| Economics, Department of | 6% | 23% | 20% | 21% | 20% | 21% | 19 |
| English and Drama, Department of | 46% | 47% | 50% | 50% | 59% | 59% | 17 |
| Geography, Department of | 20% | 50% | 38% | 38% | 38% | 38% | 16 |
| Historical Studies23, Department of | 40% | 42% | 40% | 38% | 38% | 41% | 27 |
| Language Studies, Department of | – | 40% | 36% | 33% | 29% | 33% | 15 |
| Management, Department of | 18% | 26% | 23% | 23% | 27% | 32% | 28 |
| Mathematical and Computational Sciences24, Department of | 8% | 13% | 13% | 17% | 14% | 14% | 21 |
| Philosophy, Department of | – | 29% | 27% | 27% | 27% | 29% | 14 |
| Political Science, Department of | – | 33% | 40% | 38% | 33% | 40% | 15 |
| Psychology, Department of | 41% | 52% | 52% | 52% | 48% | 50% | 18 |
| Sociology, Department of | 62% | 52% | 54% | 55% | 50% | 58% | 26 |
| Visual Studies25, Department of | N/A | – | – | – | 70% | 70% | 10 |
| University of Toronto Scarborough (UTSC) | |||||||
| Anthropology, Department of | – | 61% | 57% | 53% | 50% | 46% | 13 |
| Arts, Culture and Media26, Department of | N/A | 43% | 50% | 47% | 53% | 60% | 20 |
| Biological Sciences27, Department of | 31% | 25% | 27% | 30% | 32% | 32% | 25 |
| Computer and Mathematical Sciences28, Department of | 6% | 12% | 14% | 14% | 14% | 10% | 21 |
| English, Department of | 40% | 67% | 69% | 67% | 69% | 67% | 12 |
| Historical and Cultural Studies29, Department of | 20% | 53% | 56% | 56% | 53% | 50% | 16 |
| Human Geography, Department of | – | 47% | 47% | 43% | 40% | 47% | 17 |
| Management, Department of | 25% | 32% | 31% | 32% | 32% | 35% | 31 |
| Physical and Environmental Sciences30, Department of | 14% | 23% | 28% | 27% | 26% | 23% | 26 |
| Political Science, Department of | – | 53% | 53% | 56% | 55% | 53% | 19 |
| Psychology, Department of | 21% | 32% | 32% | 35% | 33% | 33% | 27 |
| Sociology, Department of | 40% | 50% | 58% | 53% | 50% | 54% | 13 |
EDU = extra departmental unit.
N/A = not applicable.
14 Only academic units with at least 10 faculty members are included in the table above. The data for 2004-05 are presented only for those units that had at least 10 faculty members in 2004-05 and later years. In addition, those units that had at least 10 faculty members in 2016-17 are included (these units will have no data in the 2004-05 column as the number of faculty in each unit was too small). For units which experienced a changed name since 2004-05, the current name appears in the table. When several departments were combined into a single department by 2016-17, the data from 2004-05 include all data from those initial departments for the purposes of comparative analysis. Prior to 2018-19 the data excluded part-time (unless they were on Phased Retirement) and the Transitional Year Program (TYP); data also excludes those on long-term disability, those on unpaid leave over one year, and clinicians. Faculty whose main appointment is in a college program (Innis, New, St Mike’s, University, and Woodsworth) have been grouped together but do not appear in the table above as they have fewer than 10 faculty members. Faculty whose main appointment is in a writing centre have been grouped together but are not seen in the data above as faculty in writing centres are all in the teaching stream.
15 Since 2014-15 the John H. Daniels Faculty of Architecture, Landscape, and Design includes the Visual Studies Program.
16 The Department of Art History was previously called the Department of the History of Art until 2019.
17 The Faculty of Arts and Science Biology included the Botany and Zoology departments in 2004-05. Starting in 2014-15 these departments became known as the Department of Cell and Systems Biology and the Department of Ecology and Evolutionary Biology and are also reported separately.
18 The Munk School of Global Affairs and Public Policy had not yet been established in 2004-05.
19 Clinical faculty are excluded from the analysis. The School of Public Health and the Institute of Health Policy, Management and Evaluation are excluded from Medicine but are reported under Public Health.
20 OISE was restructured in 2012-13. The Appendix only includes current units. In order to properly compare the faculty complement across time, individual faculty members were matched to each of the restructured departments.
21 The School of Public Health and the Institute of Health Policy, Management and Evaluation were part of the Faculty of Medicine in 2004-05. For comparative purposes they were counted as the Dalla Lana School of Public Health in 2004-05 and in later years.
22 The Department of Chemical and Physical Sciences includes Chemistry, Physics, Astronomy, and Earth Sciences.
23 The Department of Historical Studies includes Classical Civilization, Diaspora and Transnational Studies, History, History of Religion, and Women and Gender Studies.
24 The Department of Mathematical and Computational Sciences includes Mathematics, Statistics and Computer Sciences.
25 In 2004-05 faculty currently in the Department of Visual Studies were located in the Institute of Communication, Culture, Information and Technology.
26 The Department of Arts, Culture and Media includes Art History, Arts Management, Journalism, Media Studies, and Music and Culture.
27 The Department of Biological Sciences incudes Biochemistry, Botany, Microbiology, and Zoology in 2004-05.
28 The Department of Computer and Mathematical Sciences includes Mathematics, Statistics, and Computer Sciences.
29 The Department of Historical and Cultural Studies includes Classics, History, and Women and Gender Studies.
30 The Department of Physical and Environmental Sciences includes Astronomy and Astrophysics, Chemistry, Environmental Sciences, and Physics.
How to interpret this table: This shows the total tenured/tenure stream complement by Faculty31 and the percentage of faculty who were female at each rank. For example, out of the 243 faculty in the Faculty of Applied Science and Engineering, of those at the rank of Assistant Professor, 23% were female.
| Faculty | Assistant Professor | Associate Professor | Professor | Total N (Male, Female, and Another) |
|---|---|---|---|---|
| Applied Science and Engineering, Faculty of | 23% | 28% | 17% | 243 |
| Architecture, Landscape and Design, John H. Daniels Faculty of | 17% | 43% | 22% | 29 |
| Arts and Science, Faculty of | 46% | 47% | 29% | 761 |
| Dentistry, Faculty of | 50% | 64% | 6% | 37 |
| Information, Faculty of | 50% | 53% | 43% | 24 |
| Kinesiology and Physical Education, Faculty of | 56% | 56% | 29% | 25 |
| Law, Faculty of | 0% | 36% | 44% | 52 |
| Management, Joseph L. Rotman School of | 45% | 22% | 17% | 111 |
| Medicine, Temerty Faculty of | 50% | 36% | 35% | 160 |
| Music, Faculty of | 80% | 44% | 33% | 33 |
| Nursing, Lawrence S. Bloomberg Faculty of | 78% | 100% | 89% | 23 |
| Ontario Institute for Studies in Education (OISE) | 73% | 62% | 61% | 93 |
| Pharmacy, Leslie Dan Faculty of | 33% | 60% | 48% | 29 |
| Public Health, Dalla Lana School of | 88% | 58% | 48% | 41 |
| Social Work, Factor-Inwentash Faculty of | 83% | 70% | 60% | 31 |
| University of Toronto Mississauga (UTM) | 40% | 45% | 30% | 306 |
| University of Toronto Scarborough (UTSC) | 53% | 45% | 26% | 262 |
| Total | 47% | 45% | 30% | 2,260 |
31 Only Faculties with at least 10 faculty members are included in the table above; however, figures for “Total” include all Faculties, regardless of the reporting threshold.
How to interpret this table: This shows the total continuing stream, teaching stream complement by Faculty32 and the percentage of faculty who were female at each rank. For example, out of the 112 faculty in the Faculty of Arts and Science, of those at the rank of Assistant Professor, Teaching Stream, 68% were female.
| Faculty | Assistant Professor, Teaching Stream | Associate Professor, Teaching Stream | Professor, Teaching Stream | Total N (Male, Female, and Another) |
|---|---|---|---|---|
| Applied Science and Engineering, Faculty of | 40% | 29% | 0% | 27 |
| Arts and Science, Faculty of | 68% | 36% | 55% | 112 |
| Management, Joseph L. Rotman School of | 43% | 43% | 100% | 15 |
| Medicine, Temerty Faculty of | 88% | 93% | 100% | 24 |
| Music, Faculty of | 0% | 25% | 0% | 13 |
| Ontario Institute for Studies in Education (OISE) | 75% | 60% | 0% | 14 |
| University of Toronto Mississauga (UTM) | 47% | 36% | 50% | 80 |
| University of Toronto Scarborough (UTSC) | 54% | 58% | 67% | 93 |
| Total | 57% | 49% | 52% | 422 |
32 Only academic units with at least 10 faculty members are included in the table above; however, figures for “Total” include all Faculties, regardless of the reporting threshold.
Data
Faculty complement and academic leadership workforce data is collected annually in September and reflects the active faculty complement as of September 30 of each year. For example:
- Data for the 2020-21 academic year were collected in September 2020 and reflect academic appointments as of September 30th, 2020.
Faculty Included in the Report
This report includes all appointed faculty with the following exclusions applied:
- FTEs below 20%
- Those on Long-Term Disability
- Those on unpaid leave longer than one year
- Members of the PVP group (for current purposes: President / Vice-Presidents and Vice-Provosts) who are not faculty members
- Employee Subgroup F7 = Clinical Supplement (clinicians who do not hold faculty appointments)
This data was used to supply the comparative data on the entire academic complement and includes the following employee subgroups:
- F1 = Tenured/Tenure Stream
- F2 = Contractually Limited Term Appointments (CLTA) / Part-time Limited Term; the majority of clinicians who are considered appointed faculty are included in this employee subgroup
- FA = Continuing Stream, Teaching Stream
- FB = Teaching Stream, Contractually Limited Term Appointments
- F4 = Teaching Stream, Part-time Limited Term
- F3 = Other Academics
The majority of the report then focuses on those who held continuing appointments, namely tenured and tenure stream faculty and continuing stream, teaching stream.
Tenure Stream
Tenured/tenure stream faculty comprised 84% of faculty in continuing appointments (which includes tenured/tenure stream and continuing stream, teaching stream) at the University of Toronto. Starting in the Fall 2018 data, tenured faculty who had reduced their FTE to a part-time FTE are included in the counts. These counts do not include part-time, term-limited appointed faculty.
Continuing Stream, Teaching Stream (From 2016-17 Onward)
Amendments to the Policy and Procedures on Academic Appointments (PPAA), made in 2015 as a result of the Special Joint Advisory Committee (SJAC) between the University and the University of Toronto Faculty Association, have made it possible to distinguish between continuing stream and non-continuing stream appointments in the teaching stream. Data on teaching stream faculty is included where numbers are sufficient for 2016-17 onward. Starting in the Fall 2018 data, this includes any continuing stream, teaching stream faculty who had reduced their full-time FTE to a part-time FTE, following being granted Continuing Status.
Due to the small number of pre-probationary faculty among both the tenured/tenure stream and continuing stream, teaching stream, the following ranks have been combined for reporting purposes, and labeled Assistant Professor or Assistant Professor, Teaching Stream:
- Assistant Professor and Assistant Professor (Conditional)
- Assistant Professor, Teaching Stream and Assistant Professor, Teaching Stream (Conditional)
Librarians Included in the Report
Librarians have been included in the analysis within this report since the 2018-19 and 2019-20 report. All appointed librarians are included, with the following exclusions applied:
- FTEs below 20%
- Those on Long-Term Disability
- Those on unpaid leave longer than one year
This data was used to supply the comparative data on the entire librarian complement and includes the following employee subgroups:
- L1 = Librarian Permanent Status
- L3 = Librarian Permanent Status Stream
- L2 = Librarian Non-permanent Status
As with faculty, the majority of the report then focuses on those who held continuing appointments, namely permanent status and permanent status stream librarians:
- Permanent status and permanent status stream librarians (from 2015-16 onward).
Academic Administrators Included in the Report
This analysis includes tenured/tenure stream faculty who held academic administrative positions as follows:
- Academic administrators including deans, vice deans, associate deans, and chairs/directors of EDU:As and EDU:Bs appointed under the Policy on the Appointment of Academic Administrators (PAAA); and
- Academic administrators who are members of the PVP group which includes faculty serving in the most senior roles including president, vice-presidents, provost, and vice-provosts.
- There are a small number of academic administrators who are appointed as clinical faculty or teaching stream faculty or those who hold limited-term faculty appointments. To allow for proper comparison between 2004-05 and more recent years, these academic administrators are excluded from the analysis.
- Since the report uses data as of September 30, only those academic administrators who were “active” on that date are included in the analysis.
Analysis by Unit
Analysis by unit includes Faculties, departments, and extra departmental units (EDUs) with 10 or more faculty members in any of the reported years. In cases where units were restructured between since the earliest reporting year, the comparison is based on the faculty complement in the newly restructured unit. Some units were combined for the purposes of comparative analysis between 2004-05 and 2020-21. In addition, for those units that had less than 10 faculty members in 2004-05, but 10 or more faculty members in later years, data are provided only for those years which were at or above the 10-member threshold.
Comparison to Employment Equity Report33
The Office of the Vice-President, Human Resources & Equity (HR&E)34 at the University of Toronto publishes an annual Employment Equity Report that includes information on how faculty self-identify in respect to a number of categories including gender. The Employment Equity Report differs from this report in several important ways.
The majority of the HR&E Employment Equity Report presents data on employment equity based on the Employment Equity survey that is provided to all faculty and staff via Employee Self-Service (ESS). The survey is voluntary and the results reflect answers of those faculty, and staff who responded to the survey. This report, on the other hand, relies on institutional data from the University of Toronto Human Resources Information System (HRIS) and includes all appointed faculty employed at the University of Toronto in each year.
33 These reports can be found at people.utoronto.ca/about/reports/.
34 In September 2021, the Division of Human Resources & Equity was renamed to the Division of People Strategy, Equity & Culture (PSEC).